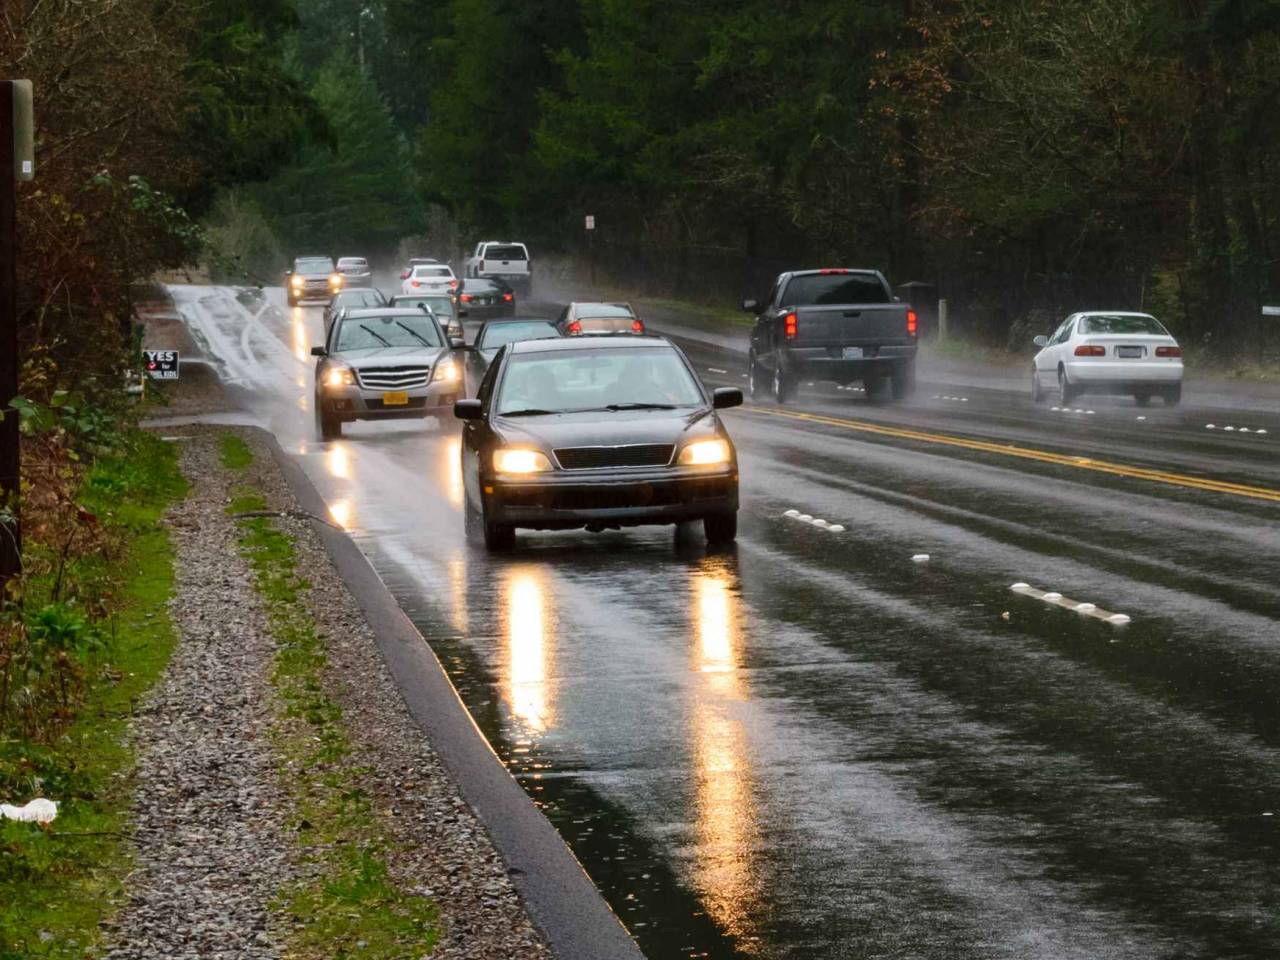
50. Auburn, WA
-
Average one-way commute time to work: 31.7 minutes (20.1% higher than national average)
-
Driving alone in car, truck, or van: 28.5 minutes
-
Carpool: 33.5 minutes
-
Public transportation: 63.4 minutes
-
Workers with one-way commutes over 60 minutes: 14.9% (6.0% more than the national average)
-
Driving alone in car, truck, or van: 9.9%
-
Carpool: 19.1%
-
Public transportation: 59%
-
Workers 16 years and over: 35,617
-
Workers who drove a car, truck, or van: 26,806
-
Workers carpooling: 3,790
-
Workers taking public transportation: 2,432
-
Workers who commute outside their county of residence: 20.9%
-
Workers who commute outside their state of residence: 0.5%
Unexpected vet bills don’t have to break the bank
Spot Pet Insurance offers coverage for treatment of accidents, illnesses, prescriptions drugs, emergency care and more.
Plus, their preventative care plan covers things like routine check-ups, microchip implantation, and vaccinations, if you want to give your pet the all-star treatment while you protect your bank account.
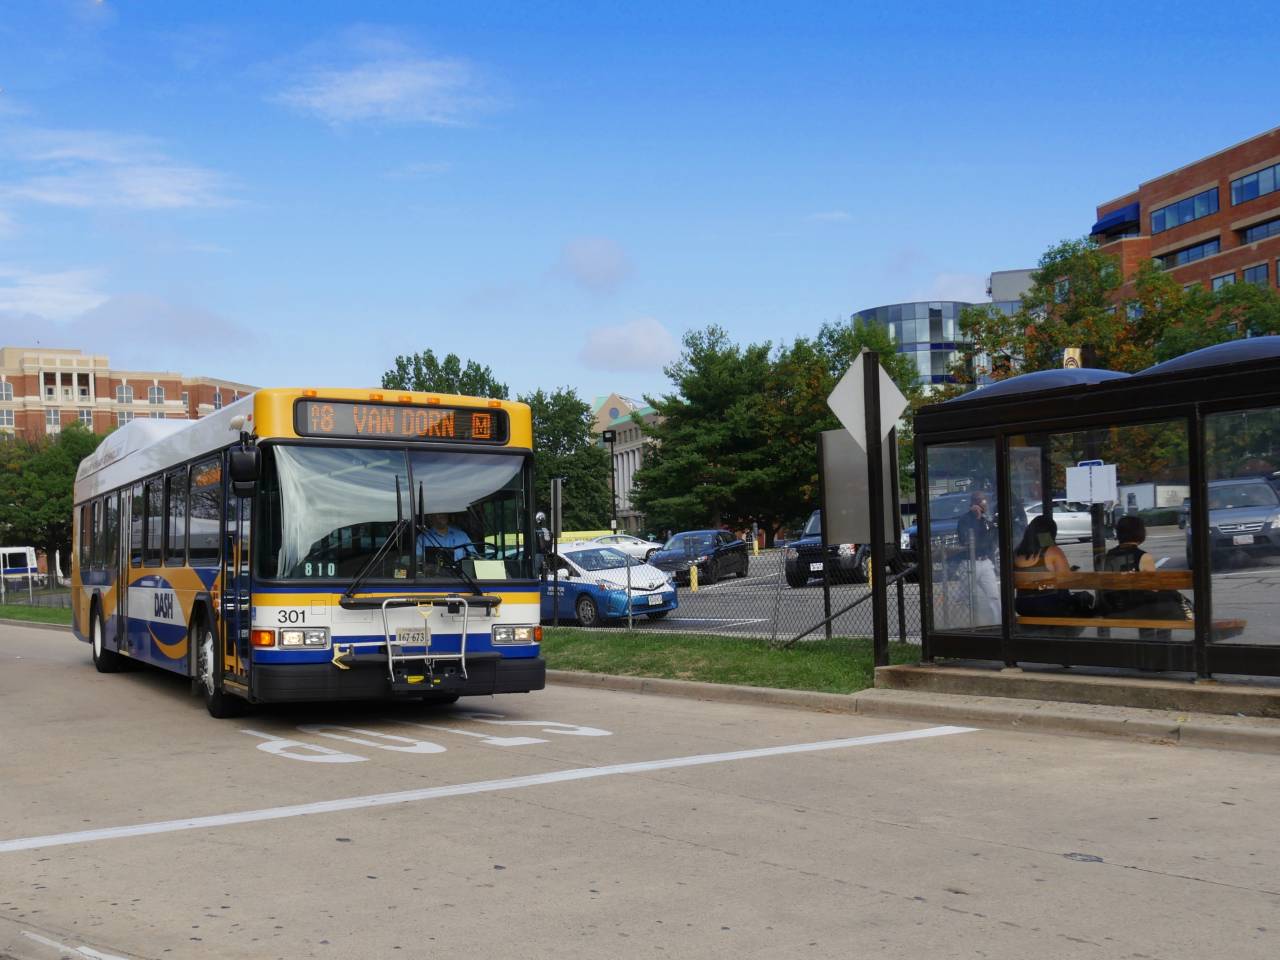
Get A Quote49. Alexandria, VA
-
Average one-way commute time to work: 31.8 minutes (20.5% higher than national average)
-
Driving alone in car, truck, or van: 27.6 minutes
-
Carpool: 31.2 minutes
-
Public transportation: 44.4 minutes
-
Workers with one-way commutes over 60 minutes: 10.8% (1.9% more than the national average)
-
Driving alone in car, truck, or van: 5.9%
-
Carpool: 11.3%
-
Public transportation: 23.8%
-
Workers 16 years and over: 96,381
-
Workers who drove a car, truck, or van: 56,079
-
Workers carpooling: 8,044
-
Workers taking public transportation: 21,100
-
Workers who commute outside their county of residence: 36.2%
-
Workers who commute outside their state of residence: 36.7%
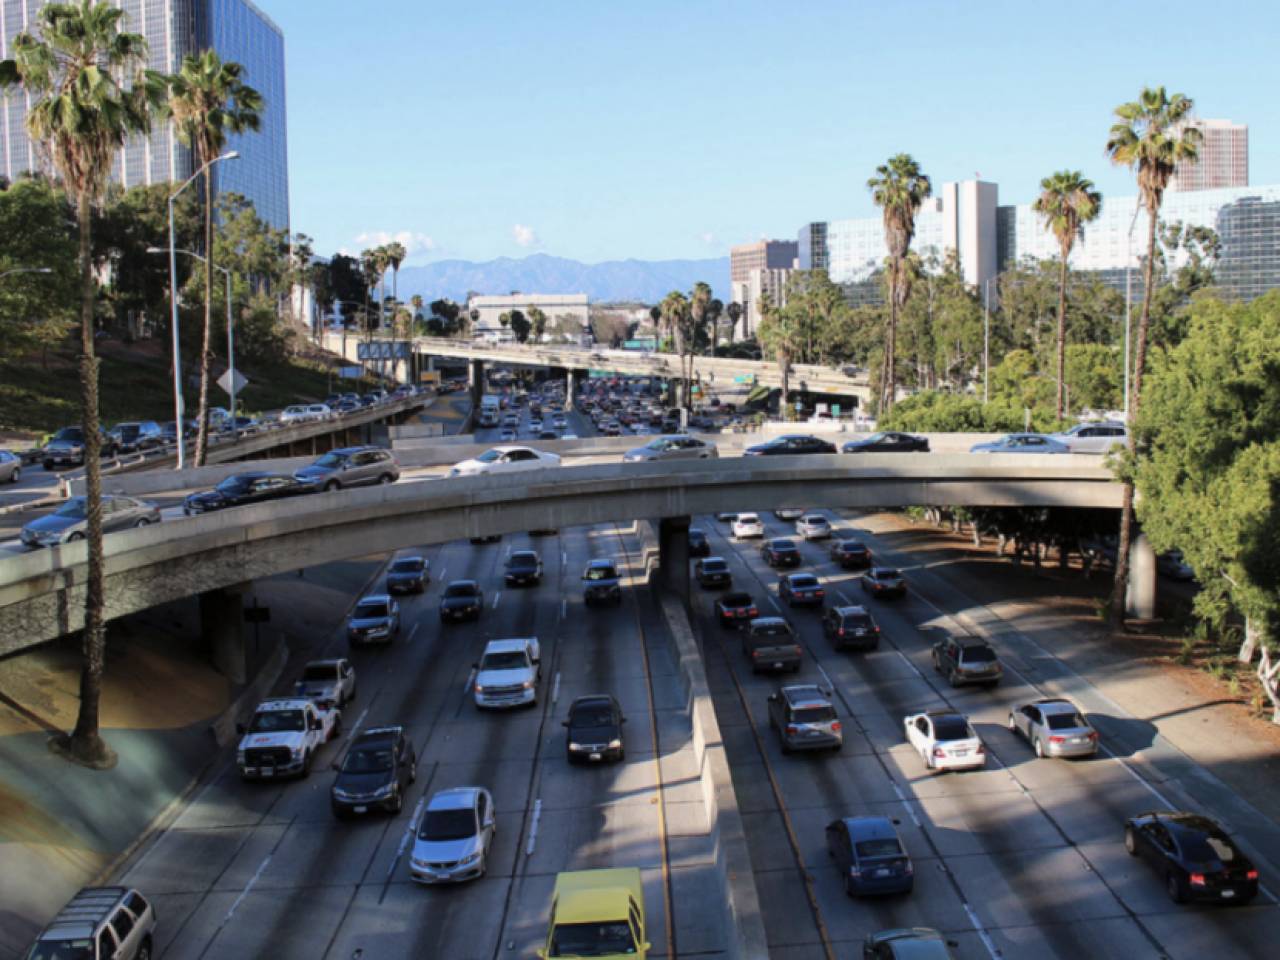
48. South Gate, CA
-
Average one-way commute time to work: 31.8 minutes (20.5% higher than national average)
-
Driving alone in car, truck, or van: 29.9 minutes
-
Carpool: 33.4 minutes
-
Public transportation: 50.5 minutes
-
Workers with one-way commutes over 60 minutes: 14.8% (5.9% more than the national average)
-
Driving alone in car, truck, or van: 11.7%
-
Carpool: 16%
-
Public transportation: 43.1%
-
Workers 16 years and over: 40,753
-
Workers who drove a car, truck, or van: 28,544
-
Workers carpooling: 6,408
-
Workers taking public transportation: 2,875
-
Workers who commute outside their county of residence: 6.9%
-
Workers who commute outside their state of residence: 0.2%
Canada’s top credit cards—find your perfect match!
Maximize rewards, save on interest, or earn cash back. Compare the best credit cards in Canada and pick the one that works for you!
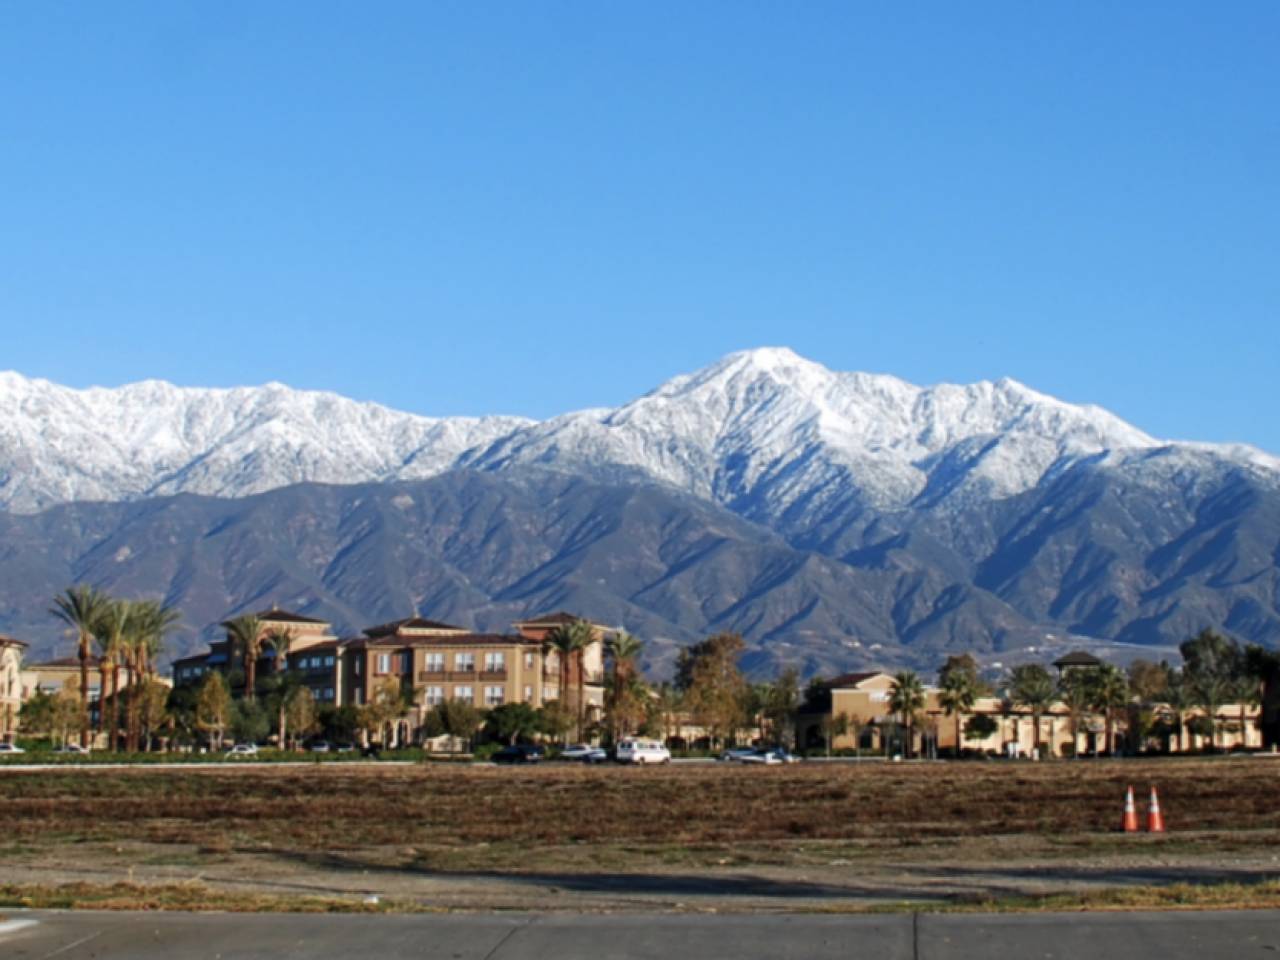
Find Your Card Now47. Rancho Cucamonga, CA
-
Average one-way commute time to work: 31.8 minutes (20.5% higher than national average)
-
Driving alone in car, truck, or van: 30.4 minutes
-
Carpool: 36.3 minutes
-
Public transportation: 75.8 minutes
-
Workers with one-way commutes over 60 minutes: 15.9% (7.0% more than the national average)
-
Driving alone in car, truck, or van: 13.8%
-
Carpool: 22.8%
-
Public transportation: 79.8%
-
Workers 16 years and over: 82,302
-
Workers who drove a car, truck, or van: 66,682
-
Workers carpooling: 8,339
-
Workers taking public transportation: 1,330
-
Workers who commute outside their county of residence: 37.4%
-
Workers who commute outside their state of residence: 0.5%
46. Oakland, CA

-
Average one-way commute time to work: 31.9 minutes (20.8% higher than national average)
-
Driving alone in car, truck, or van: 27.3 minutes
-
Carpool: 30.7 minutes
-
Public transportation: 46.9 minutes
-
Workers with one-way commutes over 60 minutes: 14.5% (5.6% more than the national average)
-
Driving alone in car, truck, or van: 9.8%
-
Carpool: 12.1%
-
Public transportation: 30.2%
-
Workers 16 years and over: 206,680
-
Workers who drove a car, truck, or van: 106,317
-
Workers carpooling: 24,013
-
Workers taking public transportation: 44,107
-
Workers who commute outside their county of residence: 35.2%
-
Workers who commute outside their state of residence: 0.3%
45. Frederick, MD

-
Average one-way commute time to work: 31.9 minutes (20.8% higher than national average)
-
Driving alone in car, truck, or van: 30.3 minutes
-
Carpool: 32.4 minutes
-
Public transportation: 78.3 minutes
-
Workers with one-way commutes over 60 minutes: 21.2% (12.3% more than the national average)
-
Driving alone in car, truck, or van: 19.9%
-
Carpool: 21.5%
-
Public transportation: 66.6%
-
Workers 16 years and over: 36,989
-
Workers who drove a car, truck, or van: 27,408
-
Workers carpooling: 4,280
-
Workers taking public transportation: 1,666
-
Workers who commute outside their county of residence: 25%
-
Workers who commute outside their state of residence: 9.9%
44. Rockville, MD

-
Average one-way commute time to work: 32 minutes (21.2% higher than national average)
-
Driving alone in car, truck, or van: 27.2 minutes
-
Carpool: 36.6 minutes
-
Public transportation: 49.5 minutes
-
Workers with one-way commutes over 60 minutes: 15.3% (6.4% more than the national average)
-
Driving alone in car, truck, or van: 9%
-
Carpool: 19.9%
-
Public transportation: 37.4%
-
Workers 16 years and over: 35,352
-
Workers who drove a car, truck, or van: 22,554
-
Workers carpooling: 2,988
-
Workers taking public transportation: 6,355
-
Workers who commute outside their county of residence: 6.6%
-
Workers who commute outside their state of residence: 24.9%
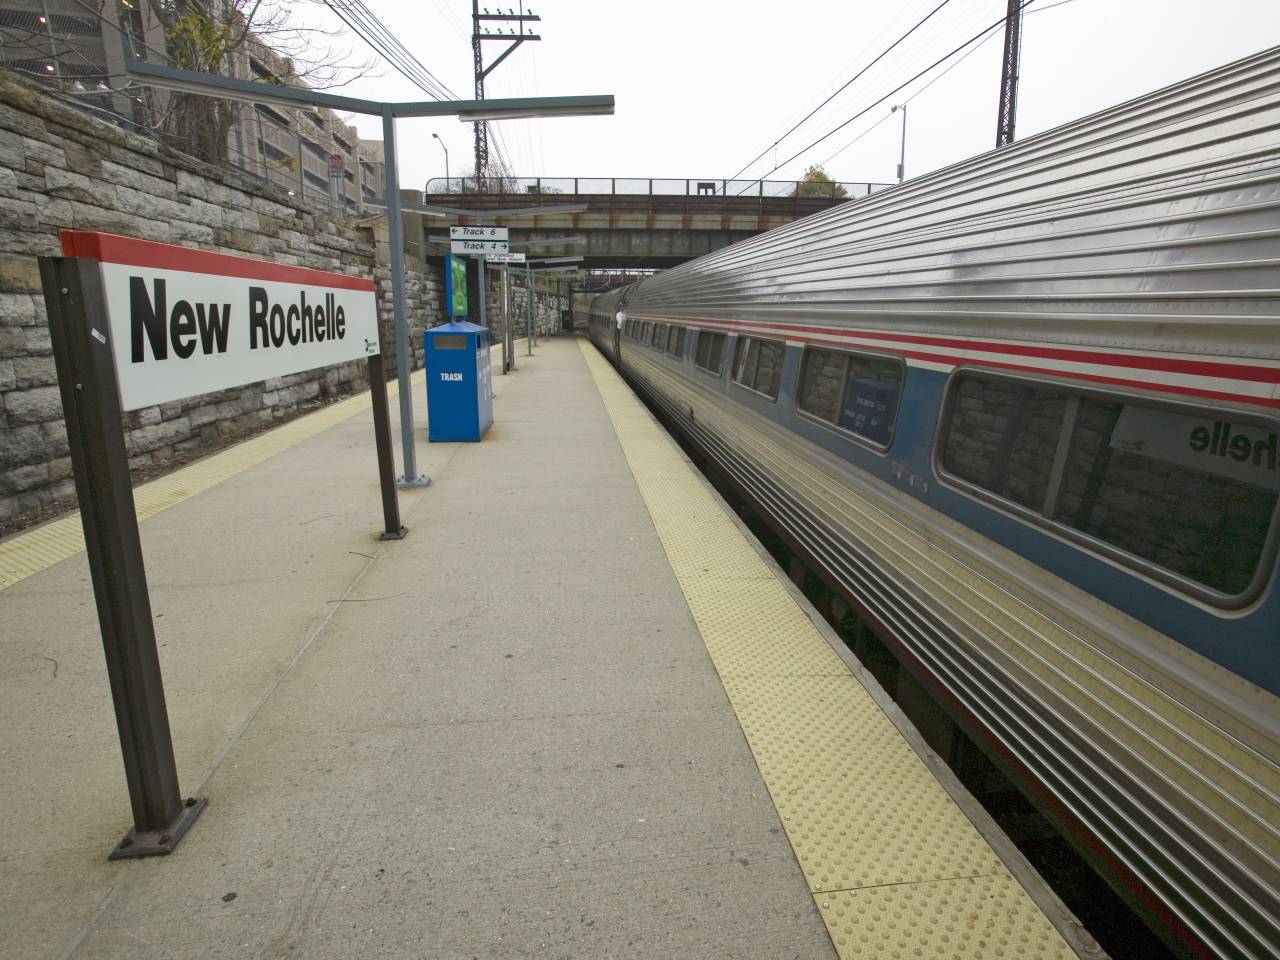
43. New Rochelle, NY
-
Average one-way commute time to work: 32.1 minutes (21.6% higher than national average)
-
Driving alone in car, truck, or van: 25.4 minutes
-
Carpool: 26.2 minutes
-
Public transportation: 55.8 minutes
-
Workers with one-way commutes over 60 minutes: 18.5% (9.6% more than the national average)
-
Driving alone in car, truck, or van: 7.8%
-
Carpool: 9.8%
-
Public transportation: 52.1%
-
Workers 16 years and over: 38,520
-
Workers who drove a car, truck, or van: 20,665
-
Workers carpooling: 3,455
-
Workers taking public transportation: 9,047
-
Workers who commute outside their county of residence: 34.3%
-
Workers who commute outside their state of residence: 4.9%
42. San Leandro, CA
-
Average one-way commute time to work: 32.4 minutes (22.7% higher than national average)
-
Driving alone in car, truck, or van: 29.1 minutes
-
Carpool: 31.4 minutes
-
Public transportation: 52.2 minutes
-
Workers with one-way commutes over 60 minutes: 15.4% (6.5% more than the national average)
-
Driving alone in car, truck, or van: 10.6%
-
Carpool: 15.3%
-
Public transportation: 41.9%
-
Workers 16 years and over: 43,595
-
Workers who drove a car, truck, or van: 30,388
-
Workers carpooling: 4,440
-
Workers taking public transportation: 5,524
-
Workers who commute outside their county of residence: 28.8%
-
Workers who commute outside their state of residence: 0.2%
41. Hayward, CA
-
Average one-way commute time to work: 32.4 minutes (22.7% higher than national average)
-
Driving alone in car, truck, or van: 30 minutes
-
Carpool: 33.7 minutes
-
Public transportation: 52.7 minutes
-
Workers with one-way commutes over 60 minutes: 15.5% (6.6% more than the national average)
-
Driving alone in car, truck, or van: 11%
-
Carpool: 18.2%
-
Public transportation: 48%
-
Workers 16 years and over: 72,302
-
Workers who drove a car, truck, or van: 51,327
-
Workers carpooling: 8,647
-
Workers taking public transportation: 6,890
-
Workers who commute outside their county of residence: 34.2%
-
Workers who commute outside their state of residence: 0.1%
40. Deltona, FL
-
Average one-way commute time to work: 32.5 minutes (23.1% higher than national average)
-
Driving alone in car, truck, or van: 32.3 minutes
-
Carpool: 35 minutes
-
Public transportation: 50.8 minutes
-
Workers with one-way commutes over 60 minutes: 12.2% (3.3% more than the national average)
-
Driving alone in car, truck, or van: 11.6%
-
Carpool: 18.6%
-
Public transportation: 60.2%
-
Workers 16 years and over: 36,299
-
Workers who drove a car, truck, or van: 31,524
-
Workers carpooling: 2,843
-
Workers taking public transportation: 123
-
Workers who commute outside their county of residence: 46%
-
Workers who commute outside their state of residence: 0.6%
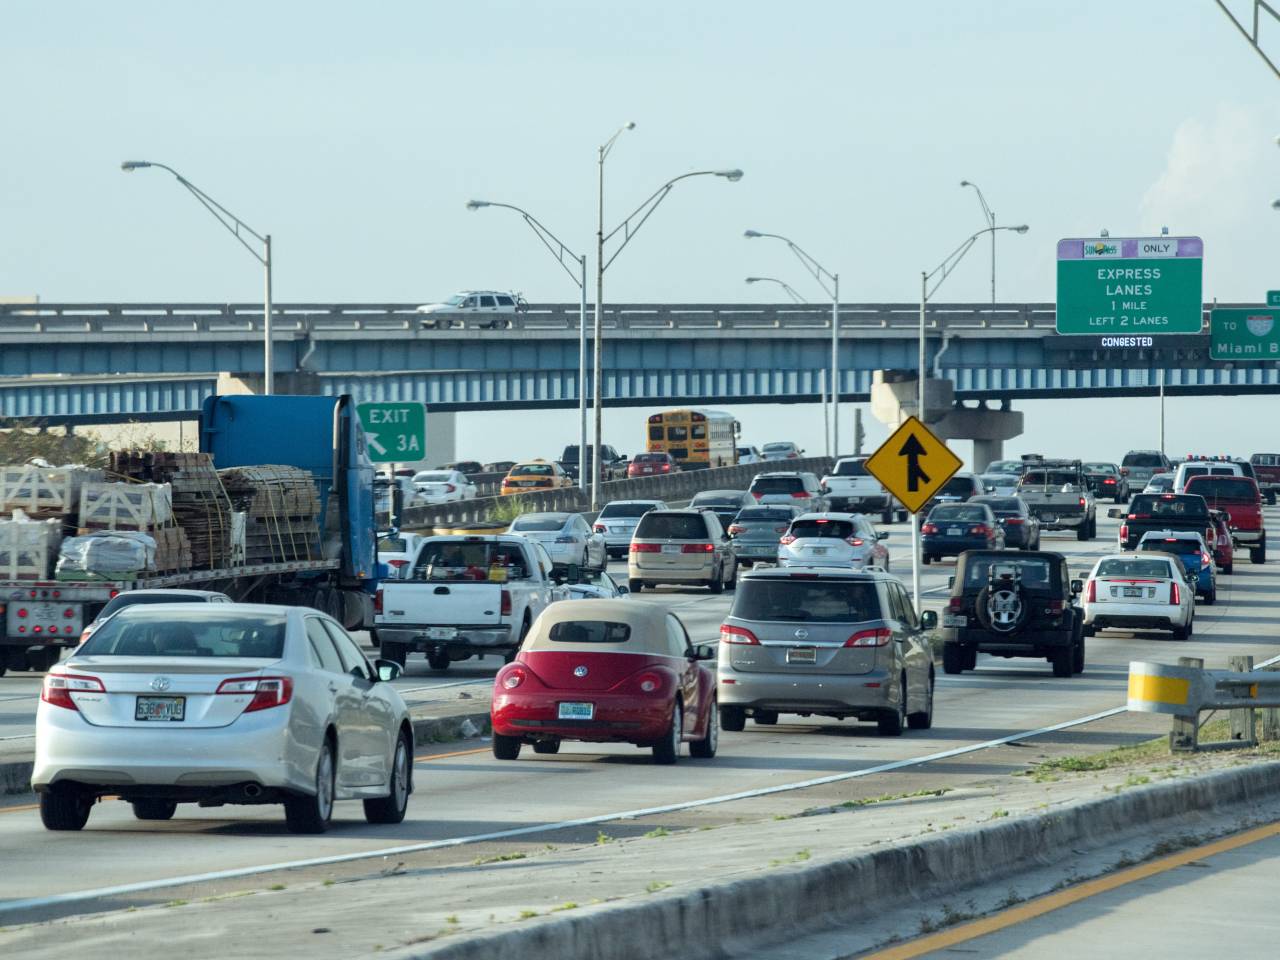
39. Kendall, FL
-
Average one-way commute time to work: 32.5 minutes (23.1% higher than national average)
-
Driving alone in car, truck, or van: 32.1 minutes
-
Carpool: 29.1 minutes
-
Public transportation: 49.5 minutes
-
Workers with one-way commutes over 60 minutes: 14.6% (5.7% more than the national average)
-
Driving alone in car, truck, or van: 14.2%
-
Carpool: 9.5%
-
Public transportation: 27.9%
-
Workers 16 years and over: 38,247
-
Workers who drove a car, truck, or van: 31,775
-
Workers carpooling: 2,507
-
Workers taking public transportation: 1,537
-
Workers who commute outside their county of residence: 3.9%
-
Workers who commute outside their state of residence: 0.4%
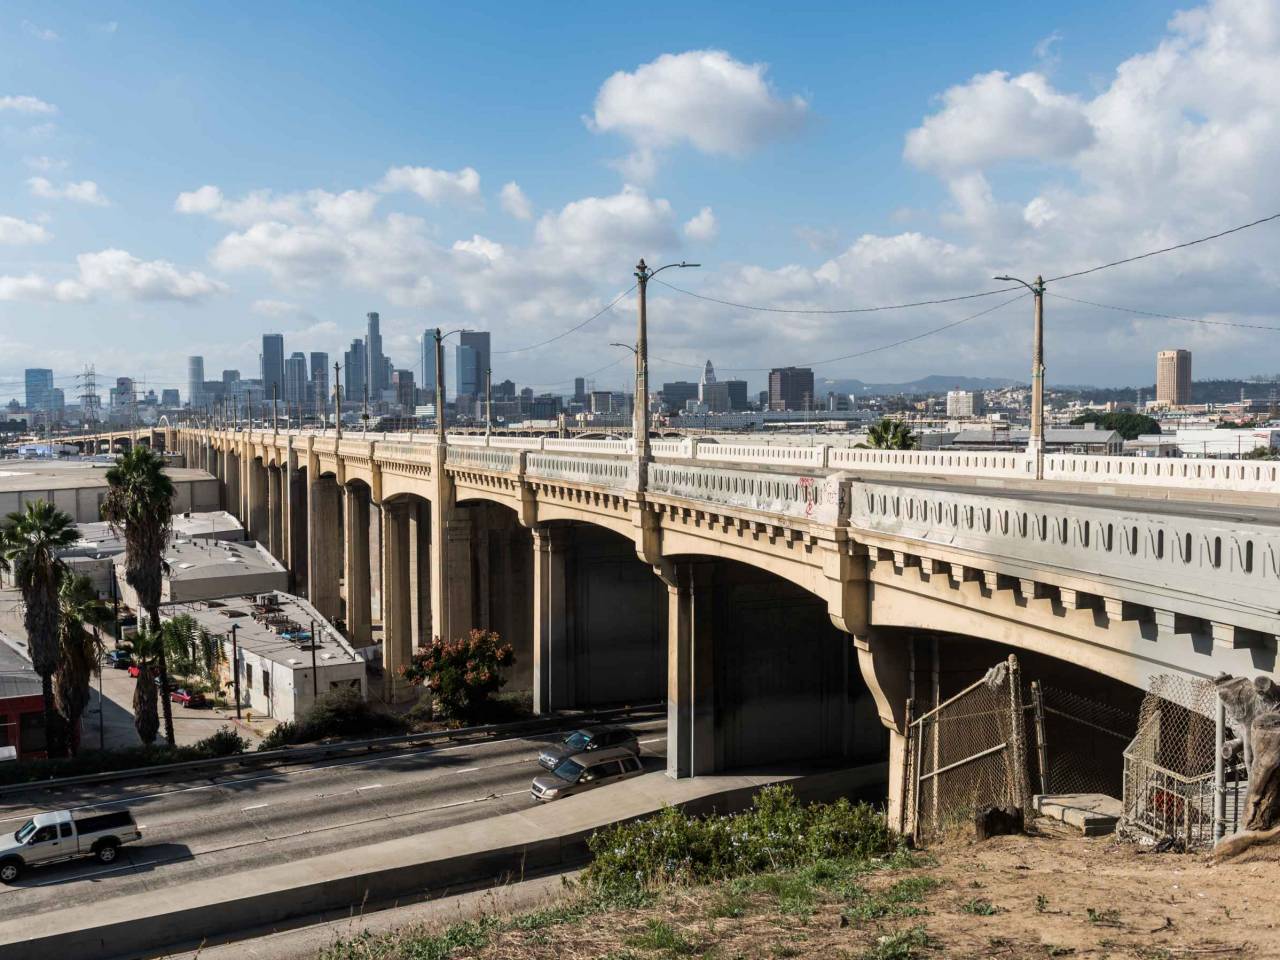
38. Whittier, CA
-
Average one-way commute time to work: 32.7 minutes (23.9% higher than national average)
-
Driving alone in car, truck, or van: 31.9 minutes
-
Carpool: 36.1 minutes
-
Public transportation: 63.7 minutes
-
Workers with one-way commutes over 60 minutes: 15.1% (6.2% more than the national average)
-
Driving alone in car, truck, or van: 13.4%
-
Carpool: 22.1%
-
Public transportation: 58.4%
-
Workers 16 years and over: 40,098
-
Workers who drove a car, truck, or van: 32,695
-
Workers carpooling: 3,705
-
Workers taking public transportation: 906
-
Workers who commute outside their county of residence: 18.6%
-
Workers who commute outside their state of residence: 0.2%
37. San Francisco, CA

-
Average one-way commute time to work: 32.8 minutes (24.2% higher than national average)
-
Driving alone in car, truck, or van: 30.5 minutes
-
Carpool: 30.1 minutes
-
Public transportation: 41.6 minutes
-
Workers with one-way commutes over 60 minutes: 14.2% (5.3% more than the national average)
-
Driving alone in car, truck, or van: 11%
-
Carpool: 10%
-
Public transportation: 23.8%
-
Workers 16 years and over: 495,315
-
Workers who drove a car, truck, or van: 170,042
-
Workers carpooling: 33,747
-
Workers taking public transportation: 168,514
-
Workers who commute outside their county of residence: 23.7%
-
Workers who commute outside their state of residence: 0.4%
36. Philadelphia, PA

-
Average one-way commute time to work: 32.9 minutes (24.6% higher than national average)
-
Driving alone in car, truck, or van: 30.5 minutes
-
Carpool: 33.4 minutes
-
Public transportation: 44.5 minutes
-
Workers with one-way commutes over 60 minutes: 14.3% (5.4% more than the national average)
-
Driving alone in car, truck, or van: 9.7%
-
Carpool: 14.7%
-
Public transportation: 28.9%
-
Workers 16 years and over: 649,574
-
Workers who drove a car, truck, or van: 331,271
-
Workers carpooling: 54,786
-
Workers taking public transportation: 164,181
-
Workers who commute outside their county of residence: 19.1%
-
Workers who commute outside their state of residence: 5.6%
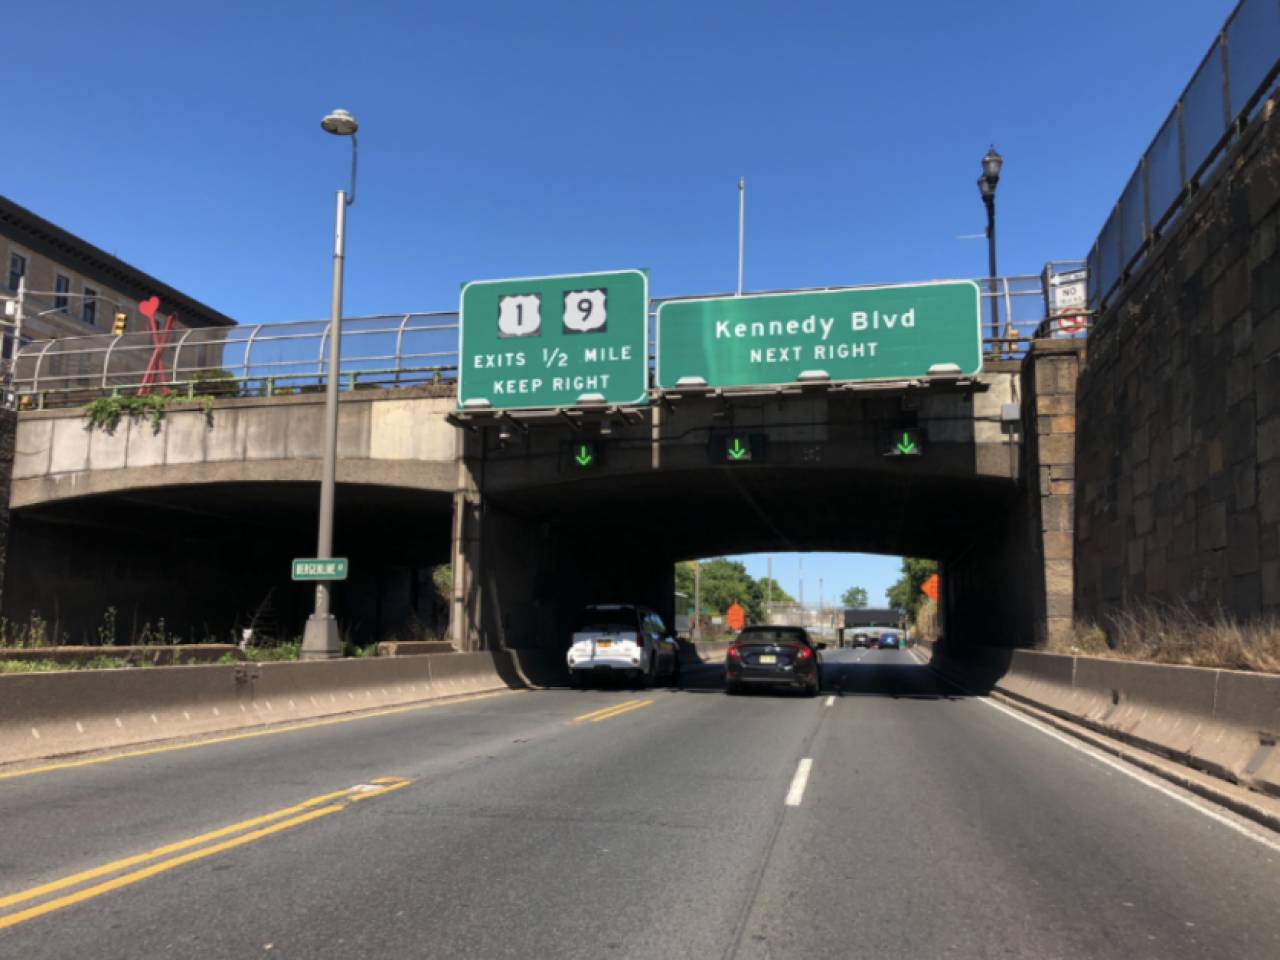
35. Union City, NJ
-
Average one-way commute time to work: 33 minutes (25.0% higher than national average)
-
Driving alone in car, truck, or van: 29.1 minutes
-
Carpool: 32.9 minutes
-
Public transportation: 41 minutes
-
Workers with one-way commutes over 60 minutes: 16.2% (7.3% more than the national average)
-
Driving alone in car, truck, or van: 8.9%
-
Carpool: 16.1%
-
Public transportation: 25.4%
-
Workers 16 years and over: 35,198
-
Workers who drove a car, truck, or van: 10,091
-
Workers carpooling: 4,435
-
Workers taking public transportation: 15,116
-
Workers who commute outside their county of residence: 25.7%
-
Workers who commute outside their state of residence: 20.5%
34. Alameda, CA

-
Average one-way commute time to work: 33 minutes (25.0% higher than national average)
-
Driving alone in car, truck, or van: 28.7 minutes
-
Carpool: 29.5 minutes
-
Public transportation: 51.5 minutes
-
Workers with one-way commutes over 60 minutes: 16.5% (7.6% more than the national average)
-
Driving alone in car, truck, or van: 10.8%
-
Carpool: 11.5%
-
Public transportation: 38.8%
-
Workers 16 years and over: 40,199
-
Workers who drove a car, truck, or van: 23,892
-
Workers carpooling: 3,439
-
Workers taking public transportation: 7,139
-
Workers who commute outside their county of residence: 34.4%
-
Workers who commute outside their state of residence: 0.7%
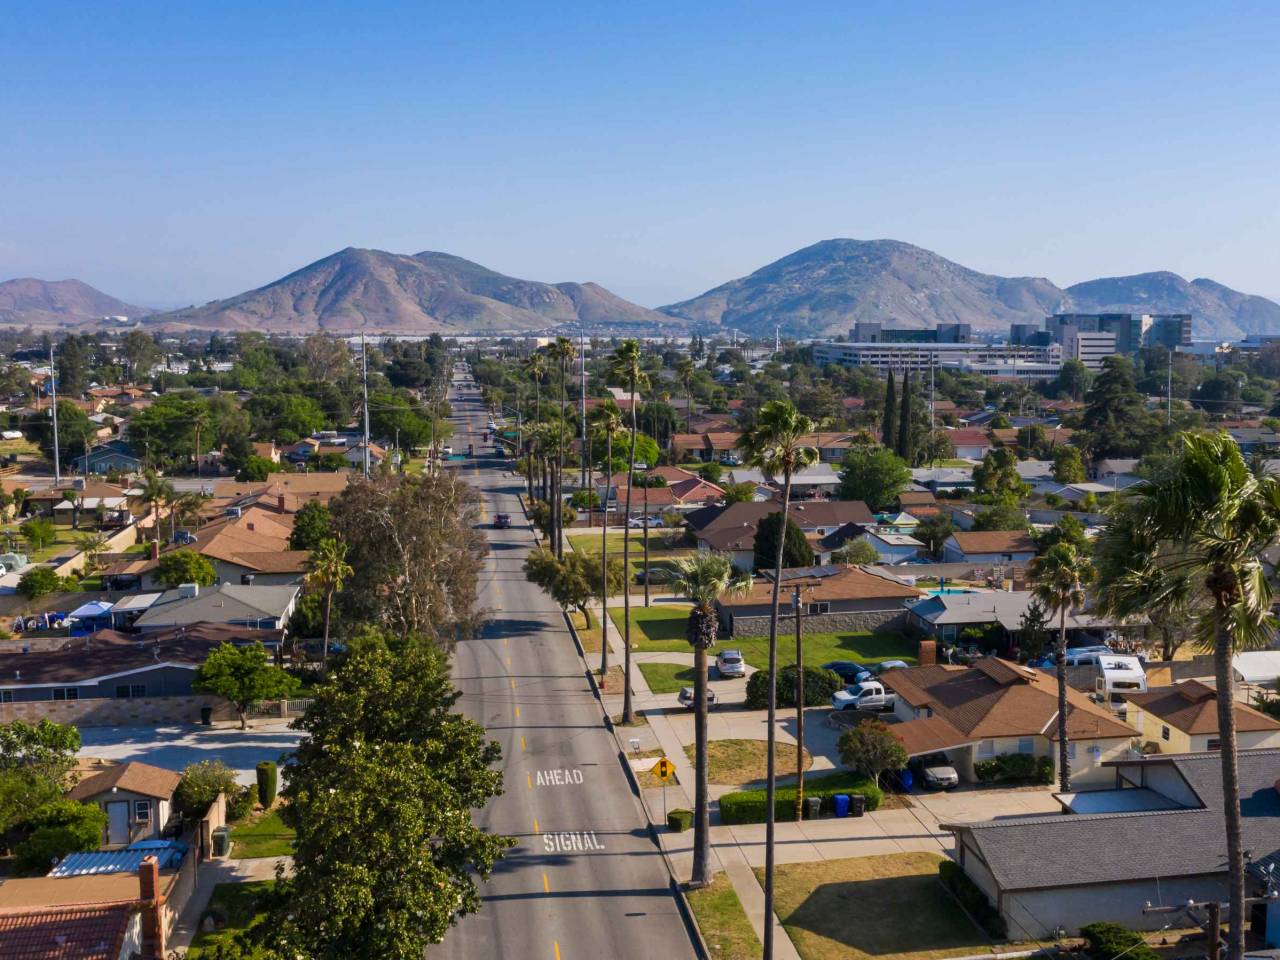
33. Fontana, CA
-
Average one-way commute time to work: 33 minutes (25.0% higher than national average)
-
Driving alone in car, truck, or van: 30.9 minutes
-
Carpool: 40.9 minutes
-
Public transportation: 76.3 minutes
-
Workers with one-way commutes over 60 minutes: 17.3% (8.4% more than the national average)
-
Driving alone in car, truck, or van: 14.3%
-
Carpool: 28.1%
-
Public transportation: 71.4%
-
Workers 16 years and over: 91,390
-
Workers who drove a car, truck, or van: 71,719
-
Workers carpooling: 12,291
-
Workers taking public transportation: 1,676
-
Workers who commute outside their county of residence: 32.5%
-
Workers who commute outside their state of residence: 0.2%
32. Pearland, TX

-
Average one-way commute time to work: 33.1 minutes (25.4% higher than national average)
-
Driving alone in car, truck, or van: 32.9 minutes
-
Carpool: 33.4 minutes
-
Public transportation: 38.8 minutes
-
Workers with one-way commutes over 60 minutes: 11.9% (3.0% more than the national average)
-
Driving alone in car, truck, or van: 11.6%
-
Carpool: 10.7%
-
Public transportation: 18.4%
-
Workers 16 years and over: 58,409
-
Workers who drove a car, truck, or van: 52,117
-
Workers carpooling: 4,067
-
Workers taking public transportation: 158
-
Workers who commute outside their county of residence: 71.7%
-
Workers who commute outside their state of residence: 0.8%
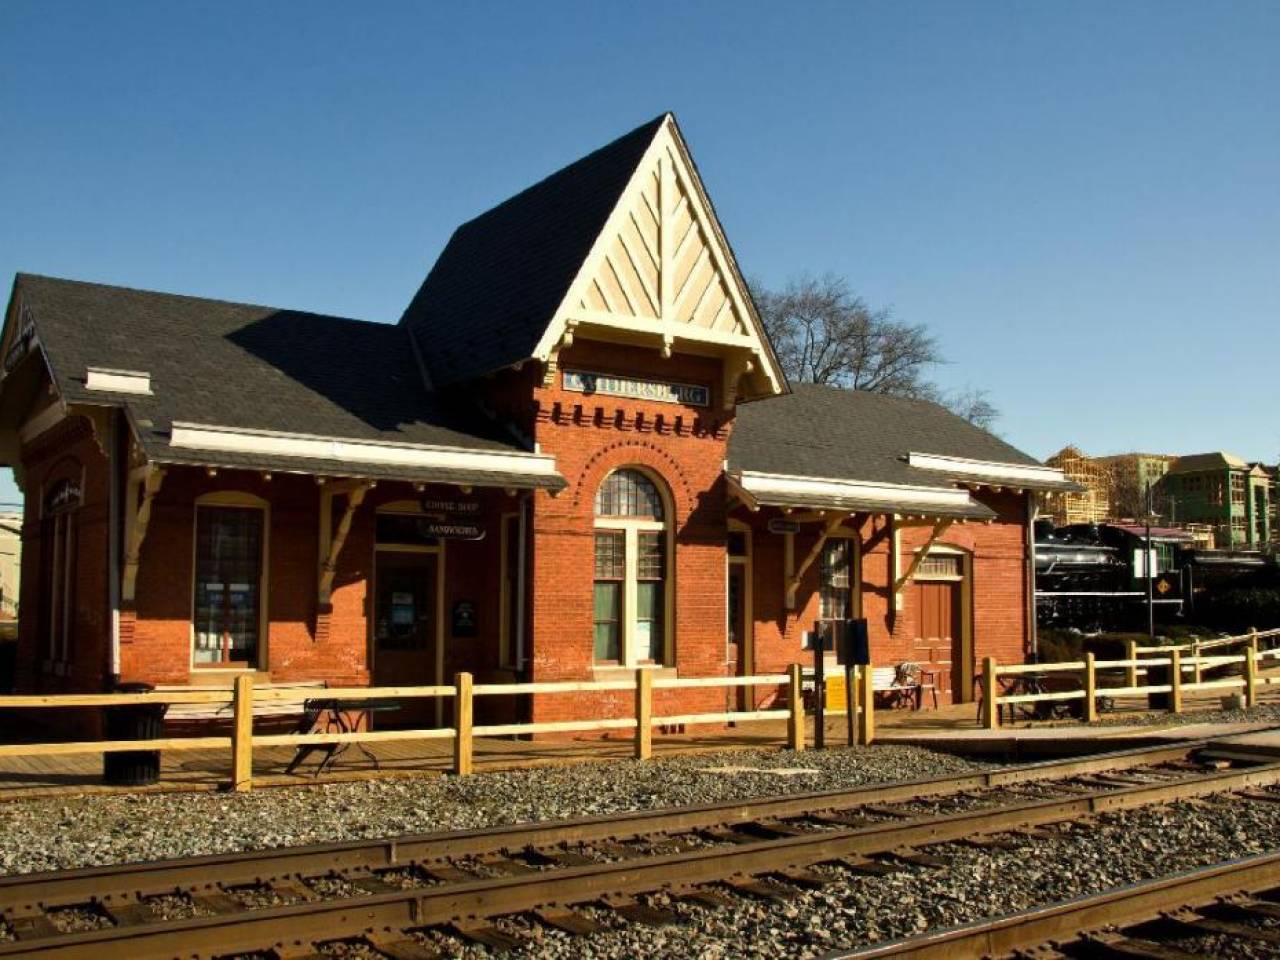
31. Gaithersburg, MD
-
Average one-way commute time to work: 33.1 minutes (25.4% higher than national average)
-
Driving alone in car, truck, or van: 29.7 minutes
-
Carpool: 31.9 minutes
-
Public transportation: 52.6 minutes
-
Workers with one-way commutes over 60 minutes: 18.8% (9.9% more than the national average)
-
Driving alone in car, truck, or van: 13.2%
-
Carpool: 14.6%
-
Public transportation: 51.2%
-
Workers 16 years and over: 35,858
-
Workers who drove a car, truck, or van: 24,276
-
Workers carpooling: 3,934
-
Workers taking public transportation: 4,888
-
Workers who commute outside their county of residence: 7.4%
-
Workers who commute outside their state of residence: 18.8%
30. Fremont, CA

-
Average one-way commute time to work: 33.6 minutes (27.3% higher than national average)
-
Driving alone in car, truck, or van: 30.2 minutes
-
Carpool: 32.1 minutes
-
Public transportation: 63.5 minutes
-
Workers with one-way commutes over 60 minutes: 15.8% (6.9% more than the national average)
-
Driving alone in car, truck, or van: 9.8%
-
Carpool: 11.6%
-
Public transportation: 68.5%
-
Workers 16 years and over: 86,040
-
Workers who drove a car, truck, or van: 62,362
-
Workers carpooling: 8,561
-
Workers taking public transportation: 8,098
-
Workers who commute outside their county of residence: 50.8%
-
Workers who commute outside their state of residence: 0.4%
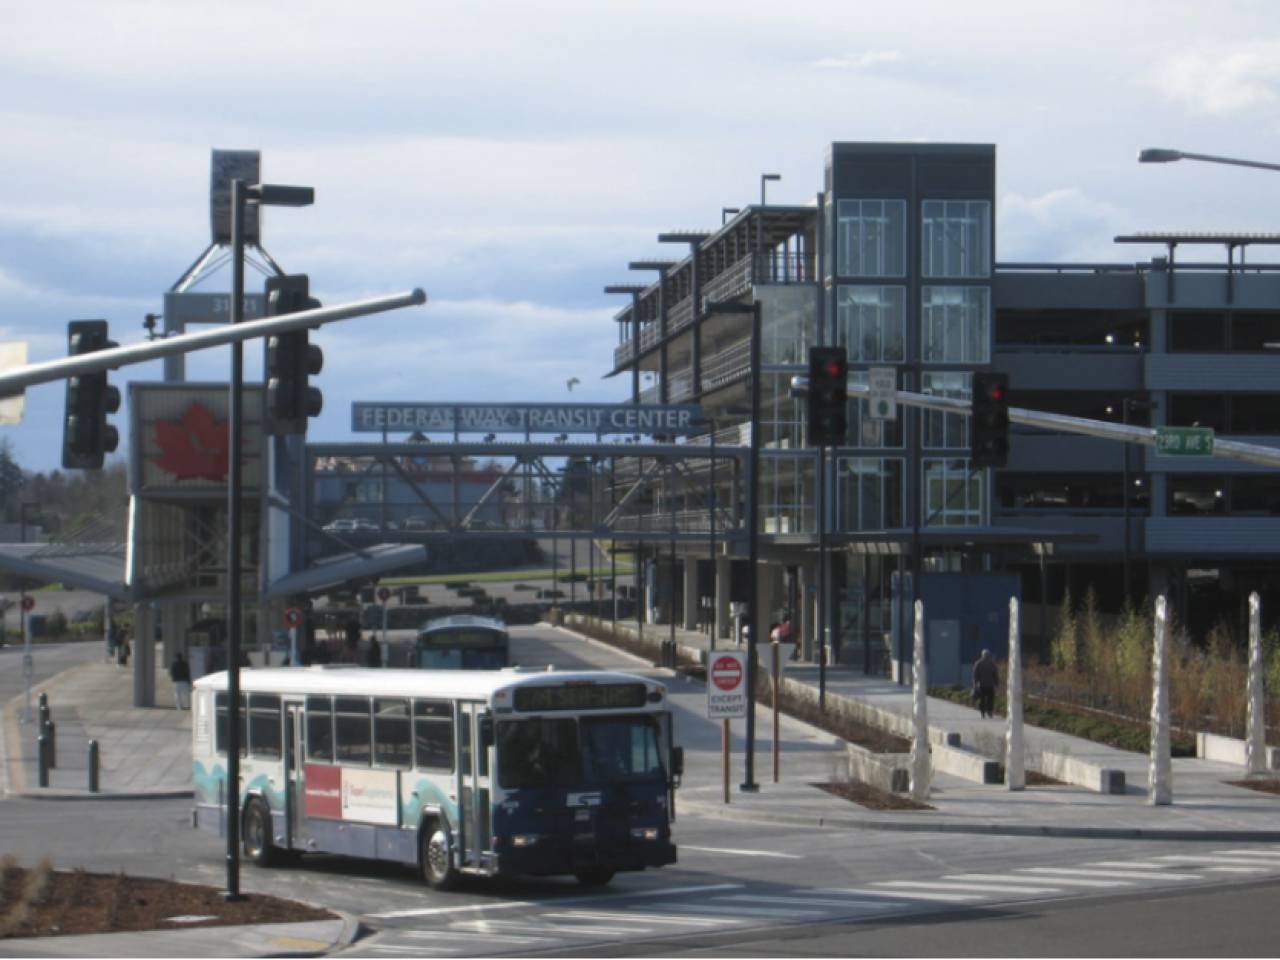
29. Federal Way, WA
-
Average one-way commute time to work: 33.6 minutes (27.3% higher than national average)
-
Driving alone in car, truck, or van: 30.3 minutes
-
Carpool: 40 minutes
-
Public transportation: 57.9 minutes
-
Workers with one-way commutes over 60 minutes: 17.1% (8.2% more than the national average)
-
Driving alone in car, truck, or van: 11.5%
-
Carpool: 24.7%
-
Public transportation: 58.1%
-
Workers 16 years and over: 46,080
-
Workers who drove a car, truck, or van: 33,481
-
Workers carpooling: 5,310
-
Workers taking public transportation: 3,777
-
Workers who commute outside their county of residence: 15.6%
-
Workers who commute outside their state of residence: 0.6%
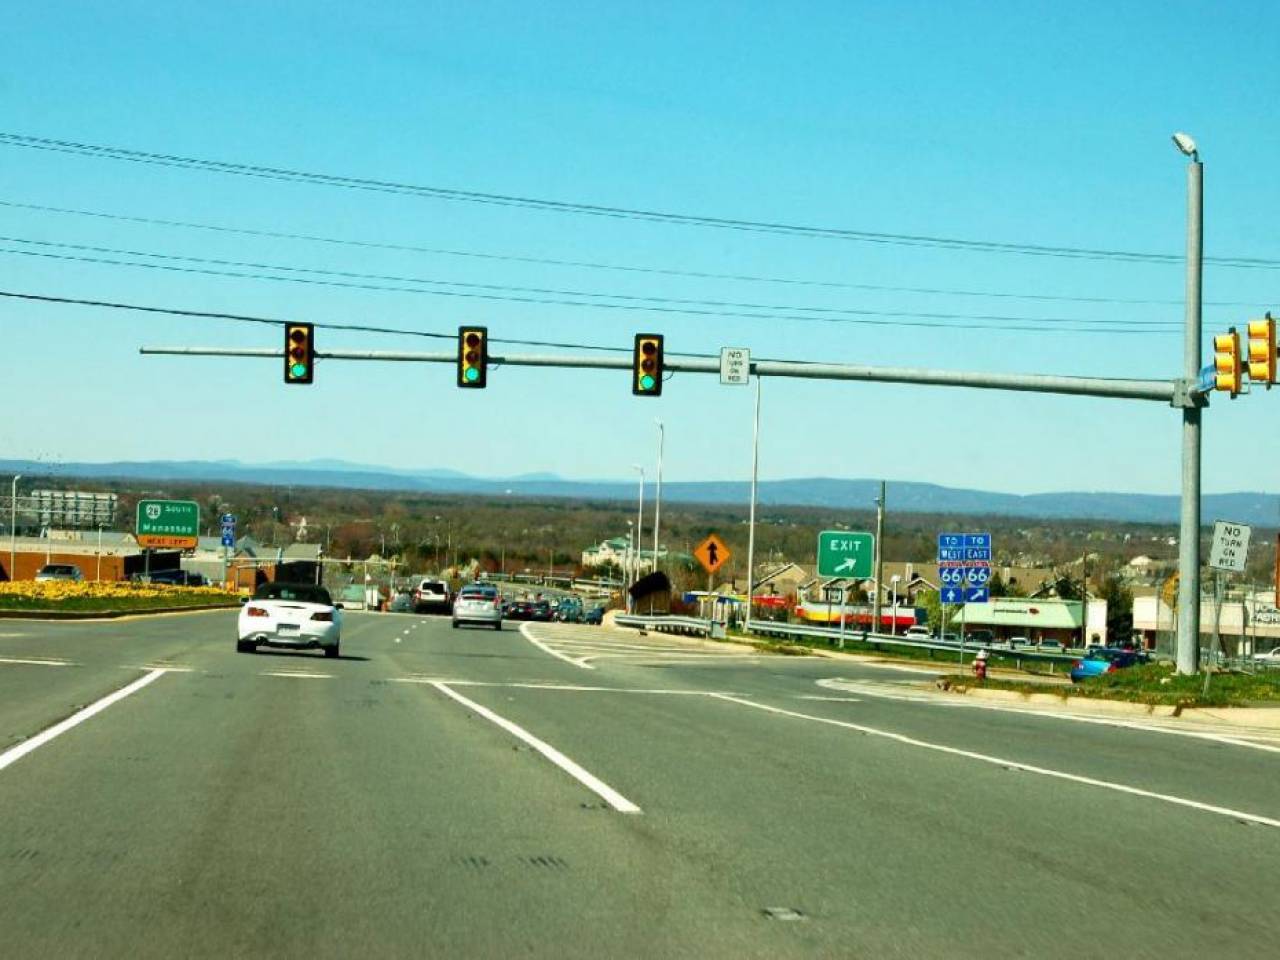
28. Centreville, VA
-
Average one-way commute time to work: 33.7 minutes (27.7% higher than national average)
-
Driving alone in car, truck, or van: 31 minutes
-
Carpool: 38.4 minutes
-
Public transportation: 81.2 minutes
-
Workers with one-way commutes over 60 minutes: 15.5% (6.6% more than the national average)
-
Driving alone in car, truck, or van: 10.8%
-
Carpool: 25.9%
-
Public transportation: 89.3%
-
Workers 16 years and over: 41,403
-
Workers who drove a car, truck, or van: 32,677
-
Workers carpooling: 3,816
-
Workers taking public transportation: 1,531
-
Workers who commute outside their county of residence: 24.6%
-
Workers who commute outside their state of residence: 11.3%
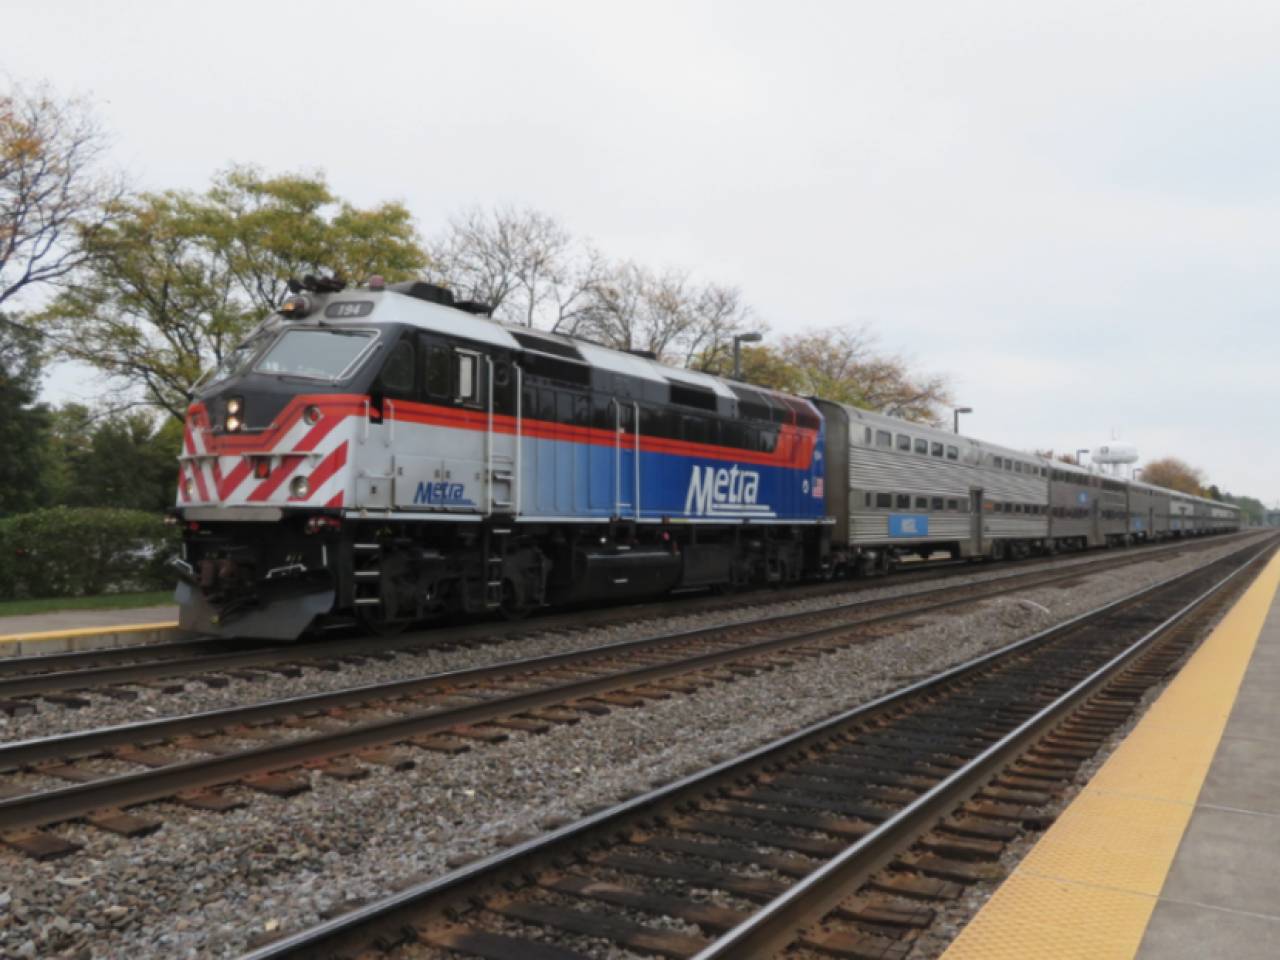
27. Naperville, IL
-
Average one-way commute time to work: 33.7 minutes (27.7% higher than national average)
-
Driving alone in car, truck, or van: 29.3 minutes
-
Carpool: 32.3 minutes
-
Public transportation: 69.1 minutes
-
Workers with one-way commutes over 60 minutes: 18.7% (9.8% more than the national average)
-
Driving alone in car, truck, or van: 11.3%
-
Carpool: 15%
-
Public transportation: 77.6%
-
Workers 16 years and over: 73,341
-
Workers who drove a car, truck, or van: 54,576
-
Workers carpooling: 3,121
-
Workers taking public transportation: 7,401
-
Workers who commute outside their county of residence: 45.9%
-
Workers who commute outside their state of residence: 1.4%
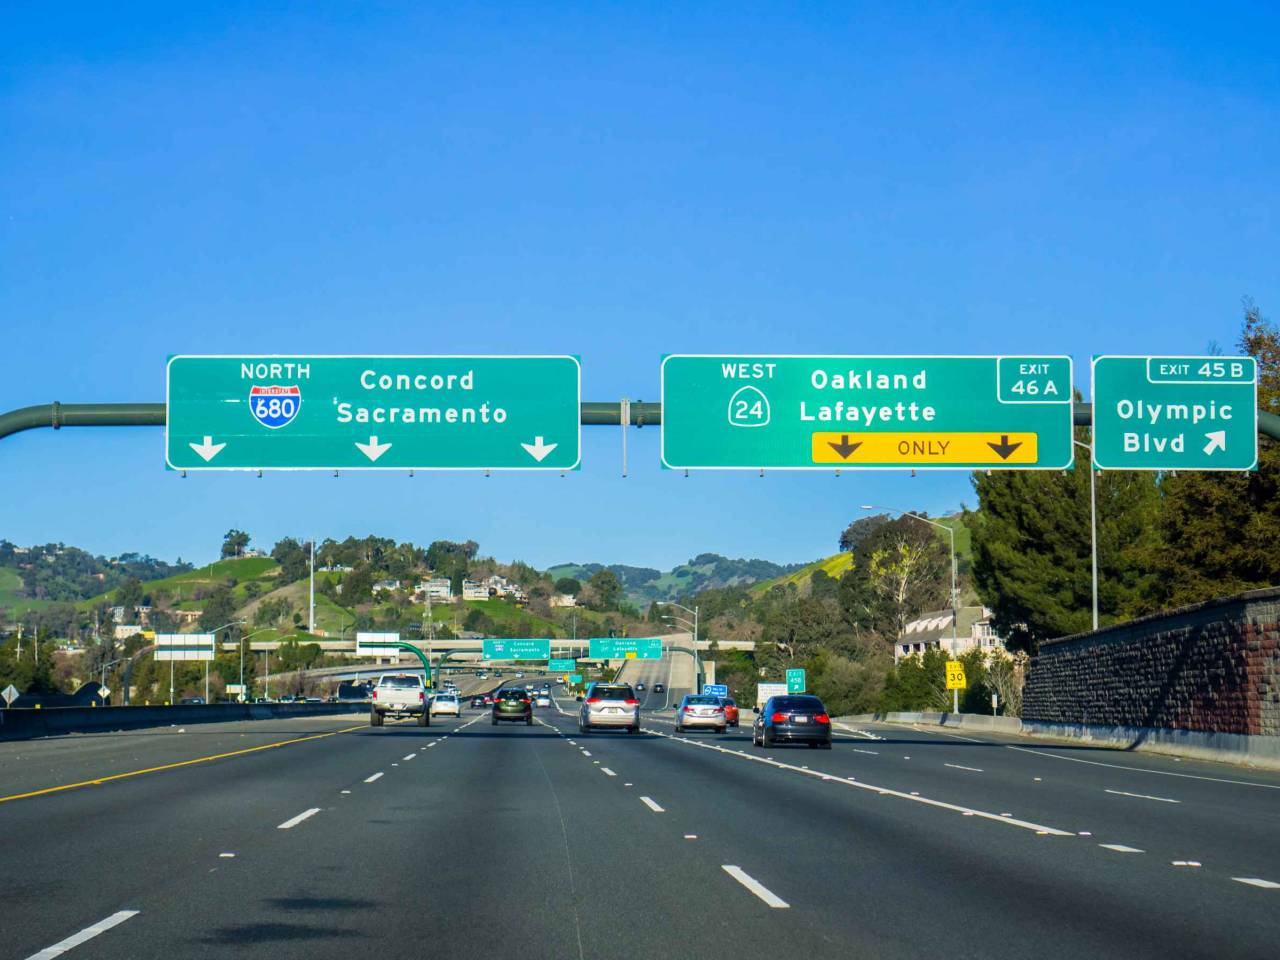
26. Concord, CA
-
Average one-way commute time to work: 33.8 minutes (28.0% higher than national average)
-
Driving alone in car, truck, or van: 30.2 minutes
-
Carpool: 35.4 minutes
-
Public transportation: 63 minutes
-
Workers with one-way commutes over 60 minutes: 20% (11.1% more than the national average)
-
Driving alone in car, truck, or van: 13.4%
-
Carpool: 22.1%
-
Public transportation: 67.2%
-
Workers 16 years and over: 61,743
-
Workers who drove a car, truck, or van: 43,277
-
Workers carpooling: 6,553
-
Workers taking public transportation: 6,020
-
Workers who commute outside their county of residence: 31.1%
-
Workers who commute outside their state of residence: 0.3%
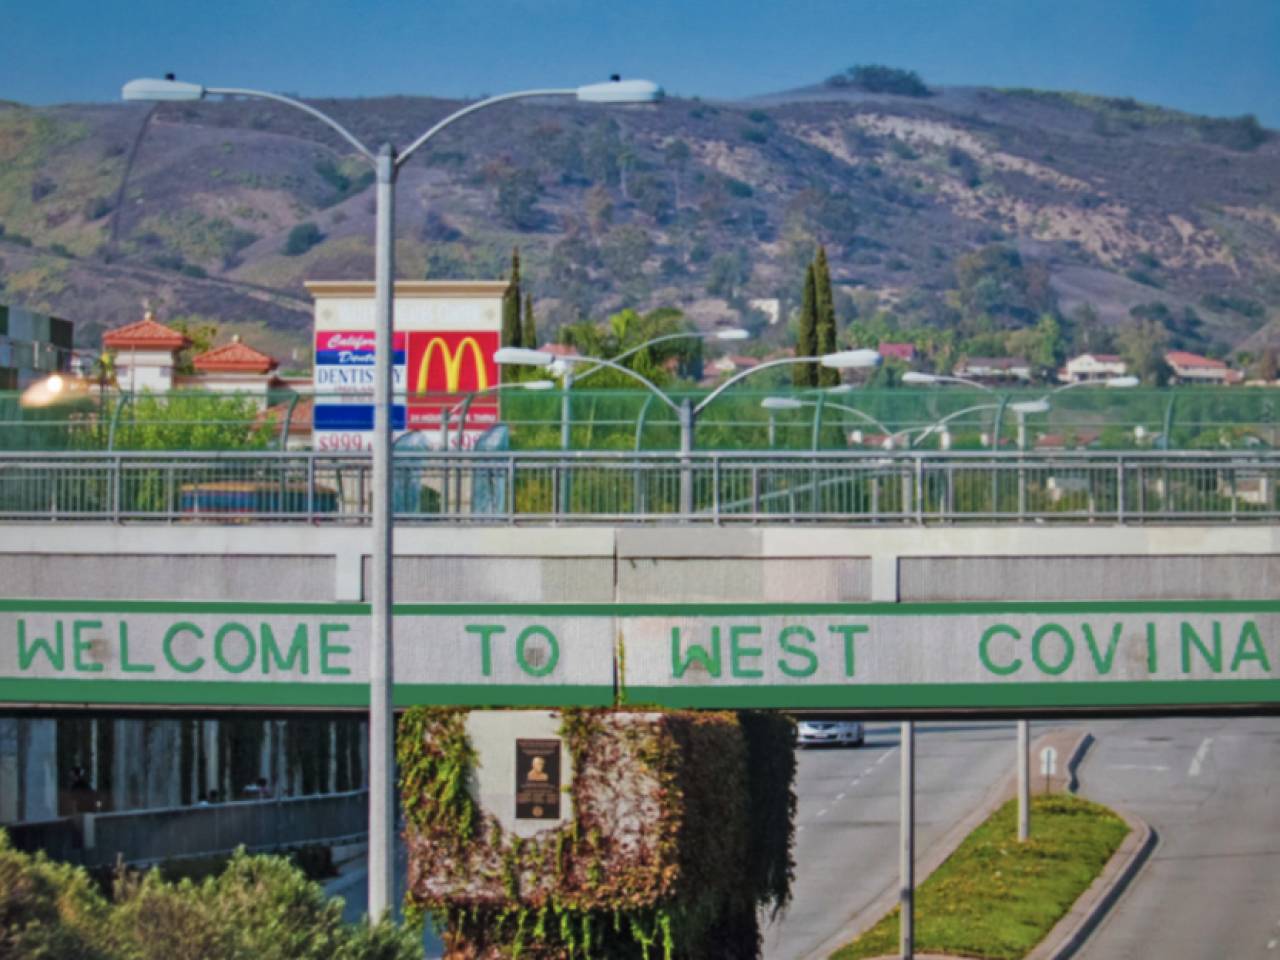
25. West Covina, CA
-
Average one-way commute time to work: 34 minutes (28.8% higher than national average)
-
Driving alone in car, truck, or van: 33.1 minutes
-
Carpool: 35.8 minutes
-
Public transportation: 52.8 minutes
-
Workers with one-way commutes over 60 minutes: 19.1% (10.2% more than the national average)
-
Driving alone in car, truck, or van: 17.7%
-
Carpool: 20.8%
-
Public transportation: 47.5%
-
Workers 16 years and over: 50,005
-
Workers who drove a car, truck, or van: 40,333
-
Workers carpooling: 5,218
-
Workers taking public transportation: 1,744
-
Workers who commute outside their county of residence: 13.6%
-
Workers who commute outside their state of residence: 0.2%
24. Lehigh Acres, FL

-
Average one-way commute time to work: 34.1 minutes (29.2% higher than national average)
-
Driving alone in car, truck, or van: 33.3 minutes
-
Carpool: 36.9 minutes
-
Public transportation: 60.8 minutes
-
Workers with one-way commutes over 60 minutes: 11.6% (2.7% more than the national average)
-
Driving alone in car, truck, or van: 10.5%
-
Carpool: 16.1%
-
Public transportation: 49.9%
-
Workers 16 years and over: 48,421
-
Workers who drove a car, truck, or van: 39,106
-
Workers carpooling: 5,847
-
Workers taking public transportation: 345
-
Workers who commute outside their county of residence: 13.1%
-
Workers who commute outside their state of residence: 0.5%
23. Pleasanton, CA

-
Average one-way commute time to work: 34.2 minutes (29.5% higher than national average)
-
Driving alone in car, truck, or van: 30.3 minutes
-
Carpool: 35 minutes
-
Public transportation: 68.2 minutes
-
Workers with one-way commutes over 60 minutes: 21.7% (12.8% more than the national average)
-
Driving alone in car, truck, or van: 15.5%
-
Carpool: 19.5%
-
Public transportation: 78%
-
Workers 16 years and over: 38,360
-
Workers who drove a car, truck, or van: 27,833
-
Workers carpooling: 2,719
-
Workers taking public transportation: 3,451
-
Workers who commute outside their county of residence: 38.1%
-
Workers who commute outside their state of residence: 0.5%
22. Yonkers, NY
-
Average one-way commute time to work: 34.3 minutes (29.9% higher than national average)
-
Driving alone in car, truck, or van: 26.2 minutes
-
Carpool: 28.3 minutes
-
Public transportation: 56.4 minutes
-
Workers with one-way commutes over 60 minutes: 20.4% (11.5% more than the national average)
-
Driving alone in car, truck, or van: 7.0%
-
Carpool: 10.1%
-
Public transportation: 53.9%
-
Workers 16 years and over: 92,169
-
Workers who drove a car, truck, or van: 49,406
-
Workers carpooling: 8,904
-
Workers taking public transportation: 25,307
-
Workers who commute outside their county of residence: 39%
-
Workers who commute outside their state of residence: 3.2%
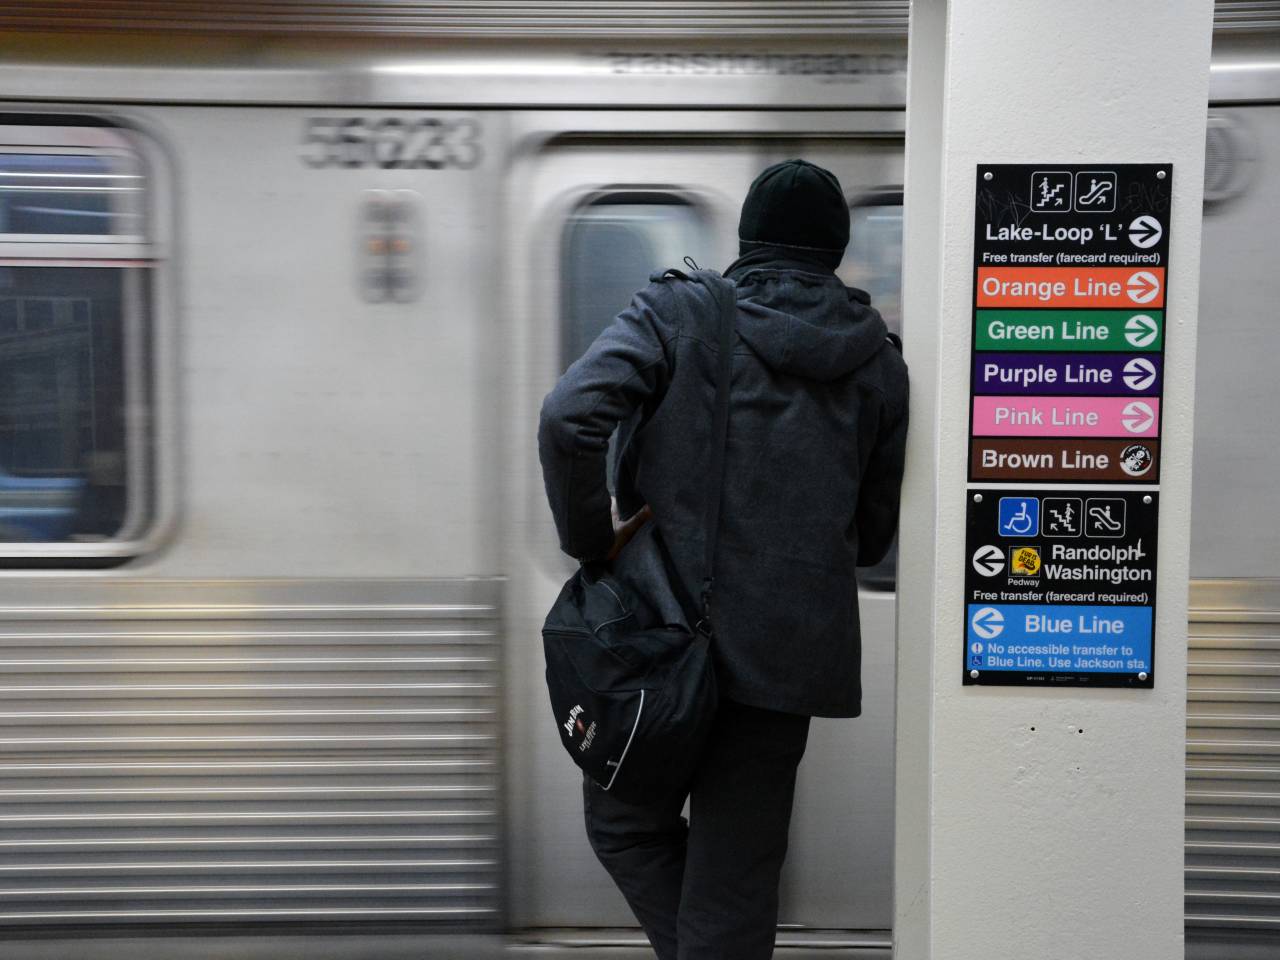
21. Chicago, IL
-
Average one-way commute time to work: 34.6 minutes (31.1% higher than national average)
-
Driving alone in car, truck, or van: 32.9 minutes
-
Carpool: 34.2 minutes
-
Public transportation: 43.3 minutes
-
Workers with one-way commutes over 60 minutes: 16.2% (7.3% more than the national average)
-
Driving alone in car, truck, or van: 13.6%
-
Carpool: 15.7%
-
Public transportation: 25.3%
-
Workers 16 years and over: 1,288,225
-
Workers who drove a car, truck, or van: 633,387
-
Workers carpooling: 101,904
-
Workers taking public transportation: 363,149
-
Workers who commute outside their county of residence: 6%
-
Workers who commute outside their state of residence: 1.2%
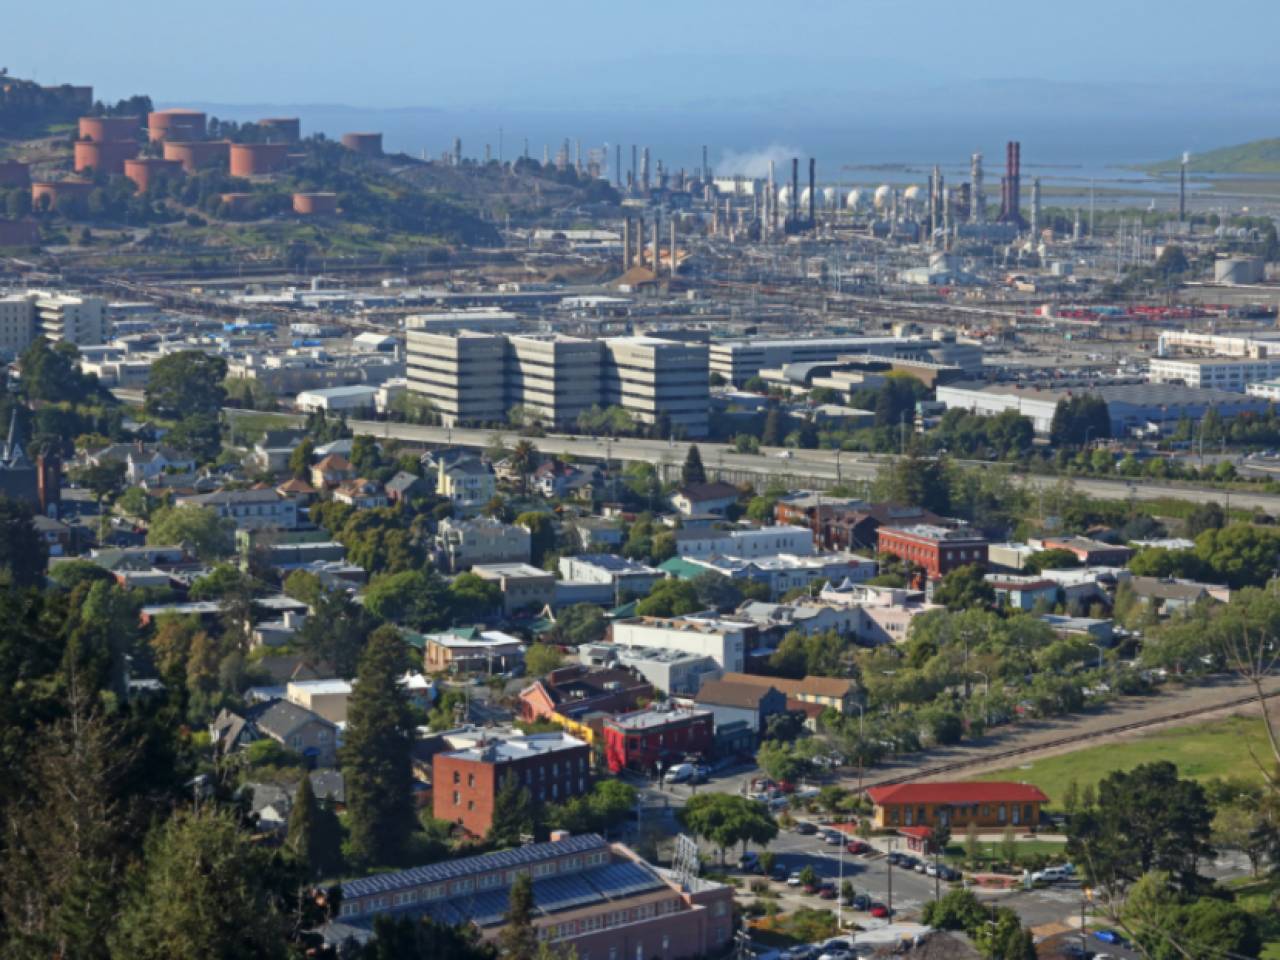
20. Richmond, CA
-
Average one-way commute time to work: 34.7 minutes (31.4% higher than national average)
-
Driving alone in car, truck, or van: 29.9 minutes
-
Carpool: 34.6 minutes
-
Public transportation: 55.8 minutes
-
Workers with one-way commutes over 60 minutes: 18.5% (9.6% more than the national average)
-
Driving alone in car, truck, or van: 11.2%
-
Carpool: 18.9%
-
Public transportation: 48.5%
-
Workers 16 years and over: 50,469
-
Workers who drove a car, truck, or van: 30,012
-
Workers carpooling: 9,205
-
Workers taking public transportation: 7,056
-
Workers who commute outside their county of residence: 61.3%
-
Workers who commute outside their state of residence: 0.4%
19. Victorville, CA

-
Average one-way commute time to work: 34.7 minutes (31.4% higher than national average)
-
Driving alone in car, truck, or van: 32.5 minutes
-
Carpool: 48.1 minutes
-
Public transportation: 45.6 minutes
-
Workers with one-way commutes over 60 minutes: 21.1% (12.2% more than the national average)
-
Driving alone in car, truck, or van: 18.6%
-
Carpool: 33.9%
-
Public transportation: 49%
-
Workers 16 years and over: 39,863
-
Workers who drove a car, truck, or van: 31,028
-
Workers carpooling: 5,602
-
Workers taking public transportation: 247
-
Workers who commute outside their county of residence: 15.5%
-
Workers who commute outside their state of residence: 0.5%
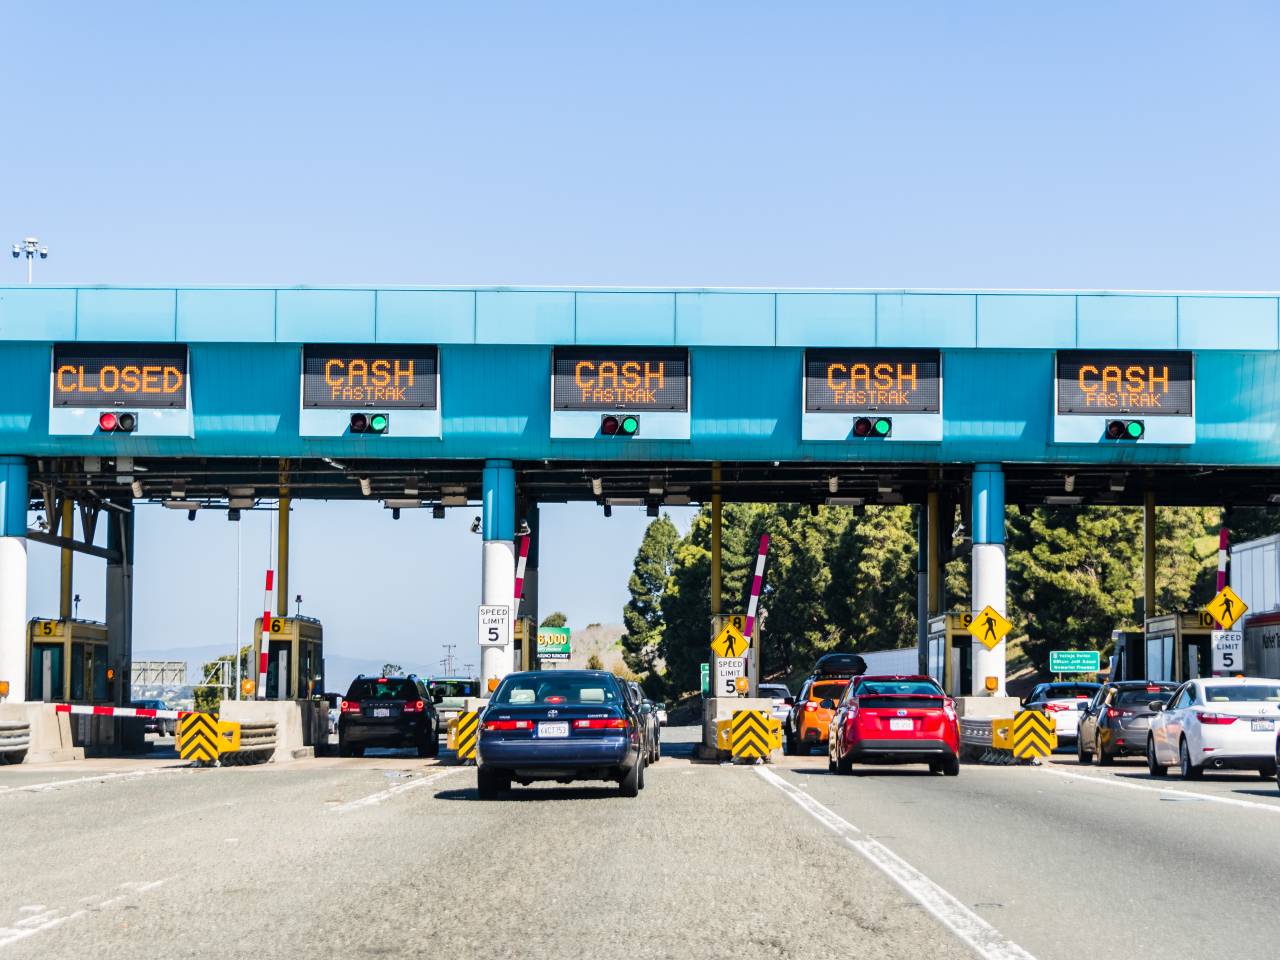
18. Vallejo, CA
-
Average one-way commute time to work: 34.8 minutes (31.8% higher than national average)
-
Driving alone in car, truck, or van: 31.7 minutes
-
Carpool: 39 minutes
-
Public transportation: 74.4 minutes
-
Workers with one-way commutes over 60 minutes: 21.3% (12.4% more than the national average)
-
Driving alone in car, truck, or van: 16.5%
-
Carpool: 27.8%
-
Public transportation: 77.5%
-
Workers 16 years and over: 52,801
-
Workers who drove a car, truck, or van: 38,065
-
Workers carpooling: 8,852
-
Workers taking public transportation: 2,549
-
Workers who commute outside their county of residence: 56.6%
-
Workers who commute outside their state of residence: 0.5%
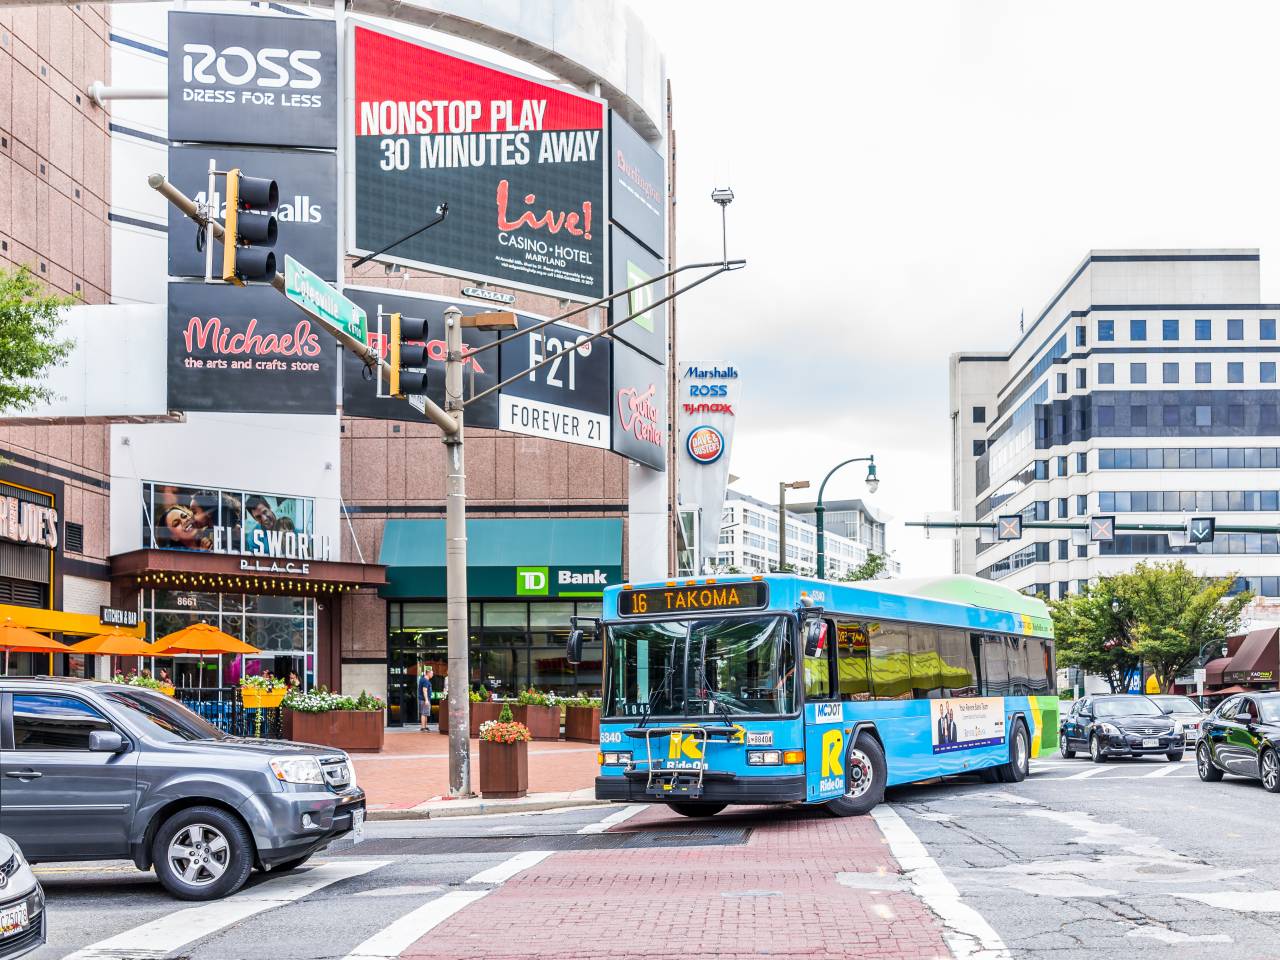
17. Silver Spring, MD
-
Average one-way commute time to work: 34.9 minutes (32.2% higher than national average)
-
Driving alone in car, truck, or van: 30.1 minutes
-
Carpool: 35.9 minutes
-
Public transportation: 46 minutes
-
Workers with one-way commutes over 60 minutes: 14.6% (5.7% more than the national average)
-
Driving alone in car, truck, or van: 7%
-
Carpool: 19.3%
-
Public transportation: 28.3%
-
Workers 16 years and over: 44,522
-
Workers who drove a car, truck, or van: 22,612
-
Workers carpooling: 4,801
-
Workers taking public transportation: 12,768
-
Workers who commute outside their county of residence: 15.6%
-
Workers who commute outside their state of residence: 41.3%
16. Santa Clarita, CA

-
Average one-way commute time to work: 34.9 minutes (32.2% higher than national average)
-
Driving alone in car, truck, or van: 33.6 minutes
-
Carpool: 36.5 minutes
-
Public transportation: 67.5 minutes
-
Workers with one-way commutes over 60 minutes: 19.7% (10.8% more than the national average)
-
Driving alone in car, truck, or van: 18%
-
Carpool: 21.8%
-
Public transportation: 64.2%
-
Workers 16 years and over: 100,616
-
Workers who drove a car, truck, or van: 77,049
-
Workers carpooling: 11,390
-
Workers taking public transportation: 3,056
-
Workers who commute outside their county of residence: 3.8%
-
Workers who commute outside their state of residence: 0.5%
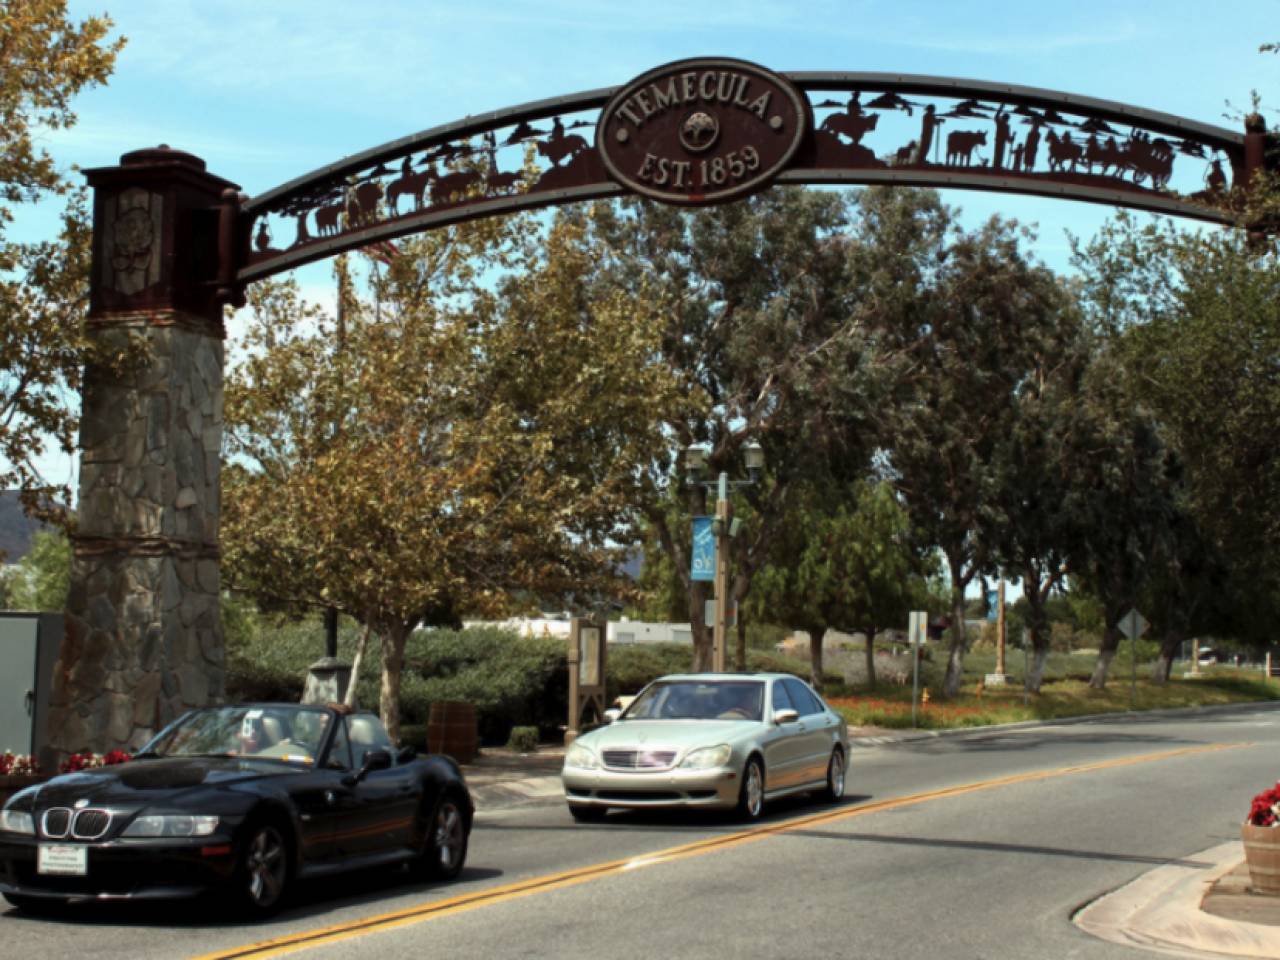
15. Temecula, CA
-
Average one-way commute time to work: 34.9 minutes (32.2% higher than national average)
-
Driving alone in car, truck, or van: 34.5 minutes
-
Carpool: 40.3 minutes
-
Public transportation: 34.1 minutes
-
Workers with one-way commutes over 60 minutes: 24.2% (15.3% more than the national average)
-
Driving alone in car, truck, or van: 23.8%
-
Carpool: 31%
-
Public transportation: 1%
-
Workers 16 years and over: 49,647
-
Workers who drove a car, truck, or van: 38,553
-
Workers carpooling: 5,631
-
Workers taking public transportation: 101
-
Workers who commute outside their county of residence: 36.6%
-
Workers who commute outside their state of residence: 0.7%
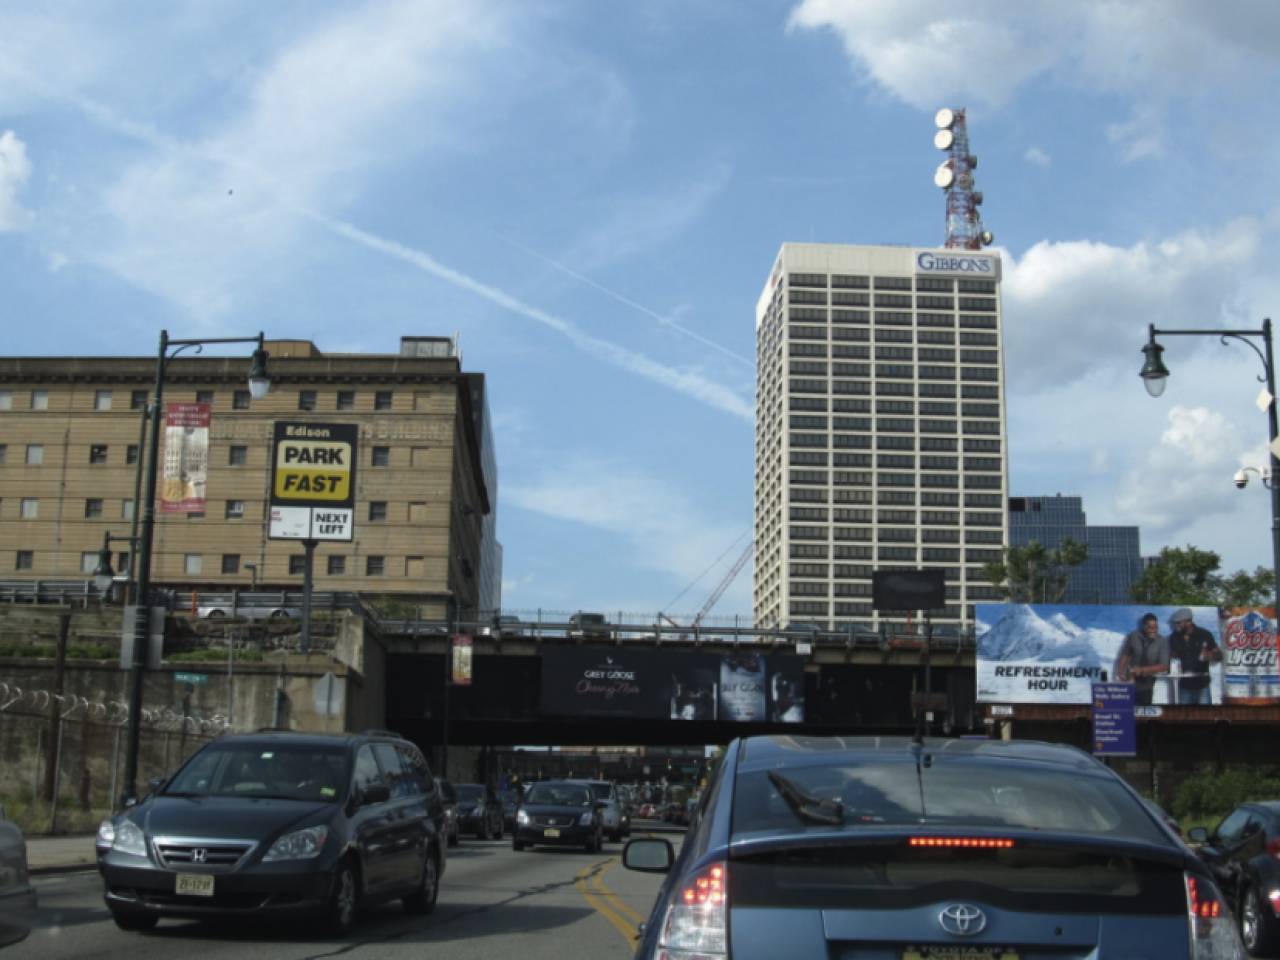
14. Newark, NJ
-
Average one-way commute time to work: 35.5 minutes (34.5% higher than national average)
-
Driving alone in car, truck, or van: 28.9 minutes
-
Carpool: 33.9 minutes
-
Public transportation: 55.6 minutes
-
Workers with one-way commutes over 60 minutes: 20.6% (11.7% more than the national average)
-
Driving alone in car, truck, or van: 10.1%
-
Carpool: 19.6%
-
Public transportation: 47.3%
-
Workers 16 years and over: 113,302
-
Workers who drove a car, truck, or van: 58,077
-
Workers carpooling: 12,667
-
Workers taking public transportation: 29,791
-
Workers who commute outside their county of residence: 31.6%
-
Workers who commute outside their state of residence: 10.9%
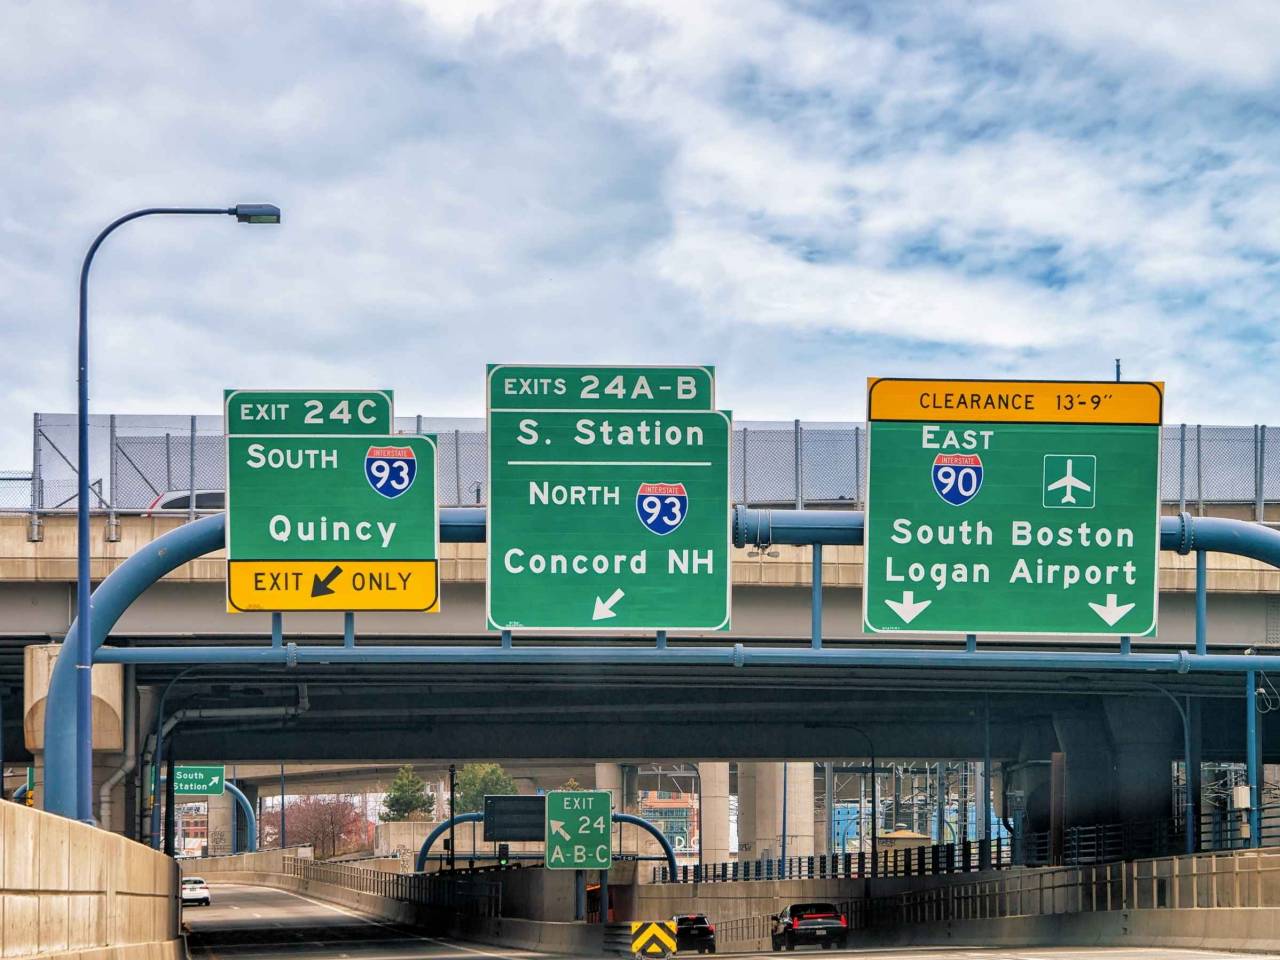
13. Quincy, MA
-
Average one-way commute time to work: 35.6 minutes (34.8% higher than national average)
-
Driving alone in car, truck, or van: 31 minutes
-
Carpool: 31.8 minutes
-
Public transportation: 48.4 minutes
-
Workers with one-way commutes over 60 minutes: 18.9% (10.0% more than the national average)
-
Driving alone in car, truck, or van: 13.6%
-
Carpool: 15.8%
-
Public transportation: 32.1%
-
Workers 16 years and over: 52,315
-
Workers who drove a car, truck, or van: 29,819
-
Workers carpooling: 4,731
-
Workers taking public transportation: 14,706
-
Workers who commute outside their county of residence: 59%
-
Workers who commute outside their state of residence: 1%
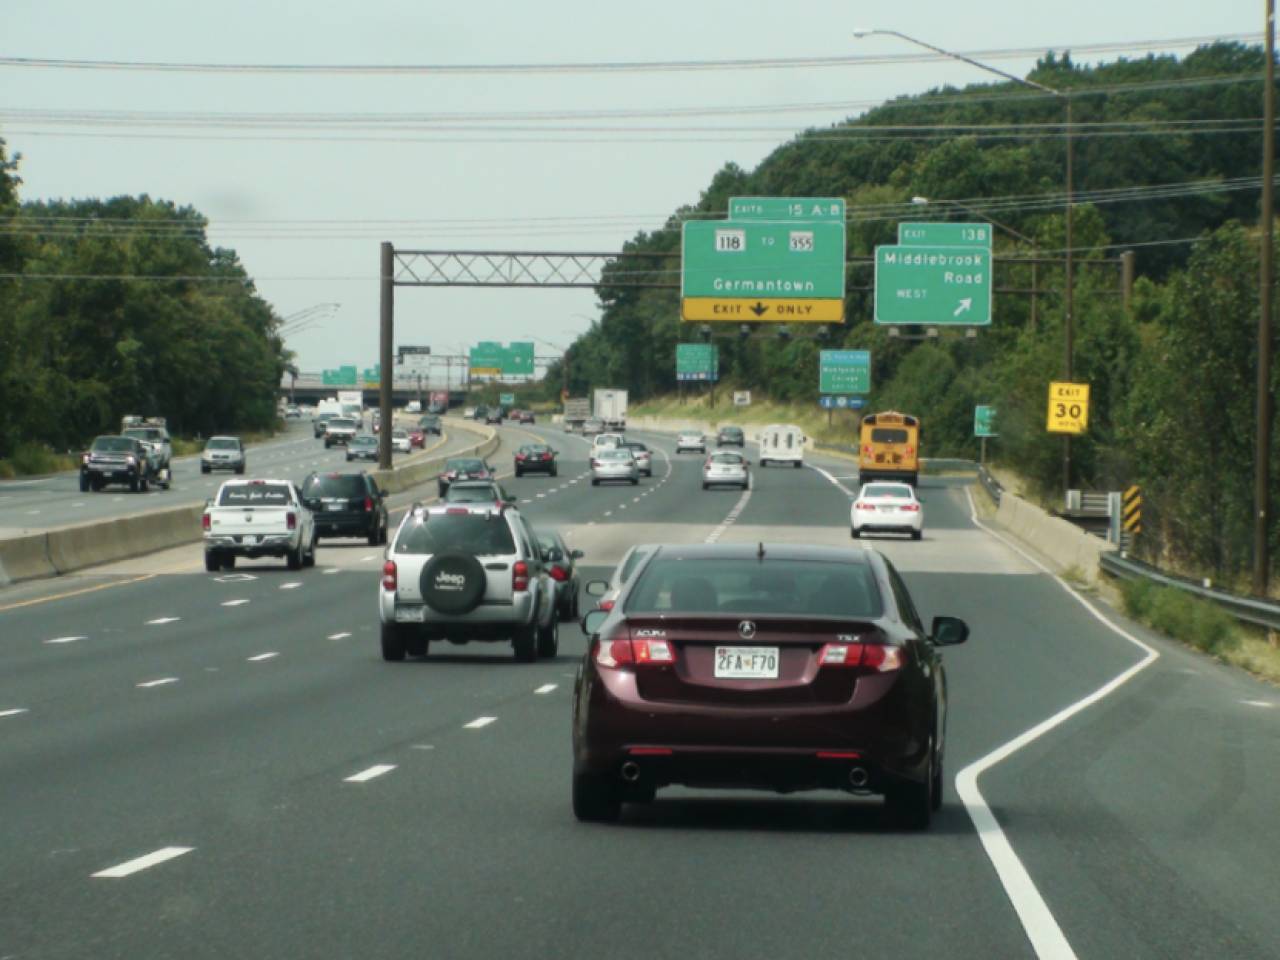
12. Germantown, MD
-
Average one-way commute time to work: 36.4 minutes (37.9% higher than national average)
-
Driving alone in car, truck, or van: 33.6 minutes
-
Carpool: 33.7 minutes
-
Public transportation: 62.8 minutes
-
Workers with one-way commutes over 60 minutes: 20.9% (12.0% more than the national average)
-
Driving alone in car, truck, or van: 16.8%
-
Carpool: 12.9%
-
Public transportation: 63.3%
-
Workers 16 years and over: 49,794
-
Workers who drove a car, truck, or van: 36,746
-
Workers carpooling: 5,176
-
Workers taking public transportation: 4,855
-
Workers who commute outside their county of residence: 9.5%
-
Workers who commute outside their state of residence: 16.8%
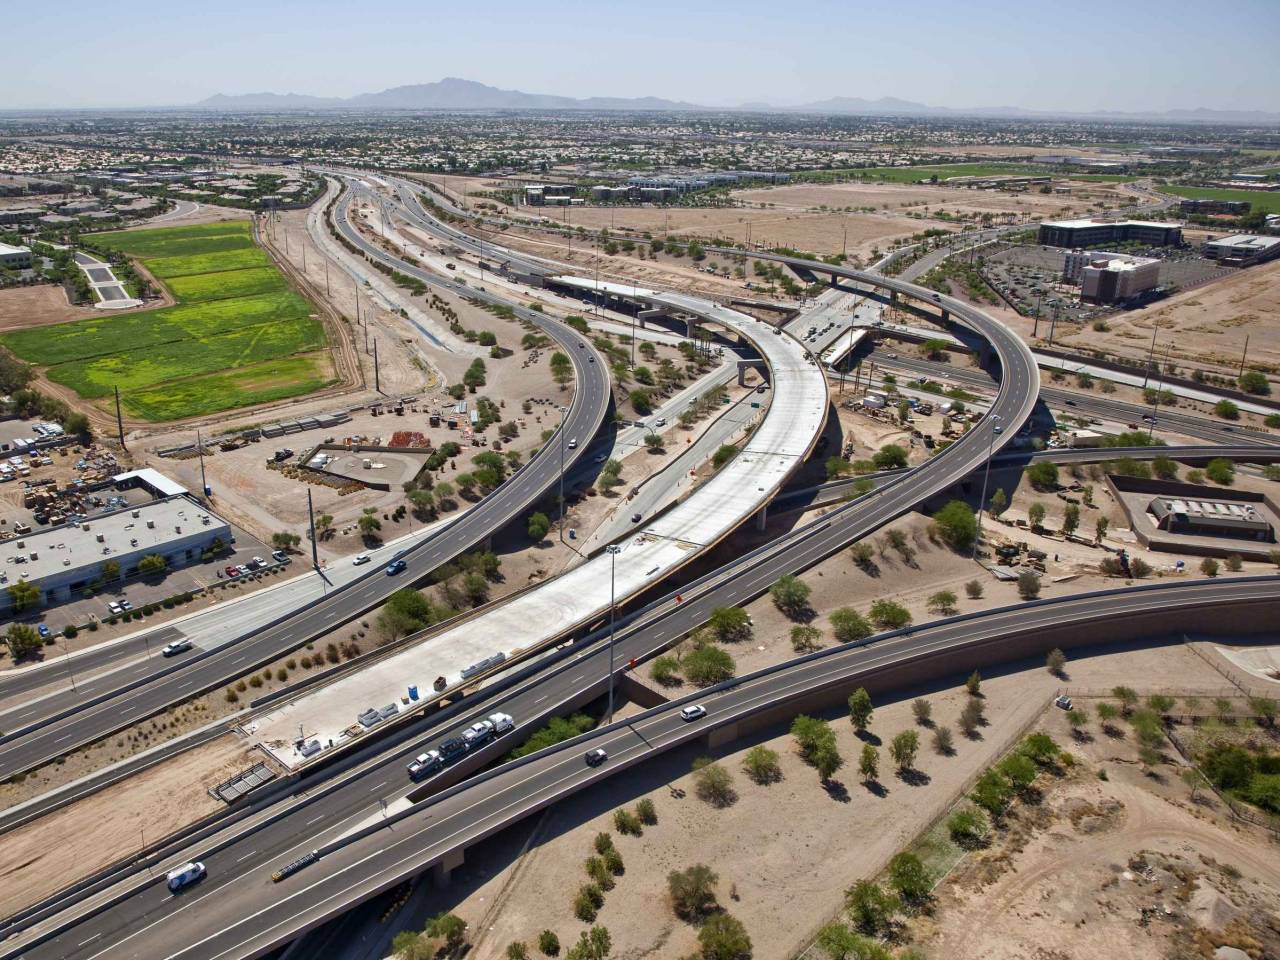
11. San Tan Valley, AZ
-
Average one-way commute time to work: 36.5 minutes (38.3% higher than national average)
-
Driving alone in car, truck, or van: 36.7 minutes
-
Carpool: 35.5 minutes
-
Public transportation: 72.2 minutes
-
Workers with one-way commutes over 60 minutes: 17% (8.1% more than the national average)
-
Driving alone in car, truck, or van: 16.8%
-
Carpool: 18%
-
Public transportation: 84.2%
-
Workers 16 years and over: 38,110
-
Workers who drove a car, truck, or van: 30,560
-
Workers carpooling: 4,571
-
Workers taking public transportation: 120
-
Workers who commute outside their county of residence: 67.5%
-
Workers who commute outside their state of residence: 0.9%
10. Corona, CA
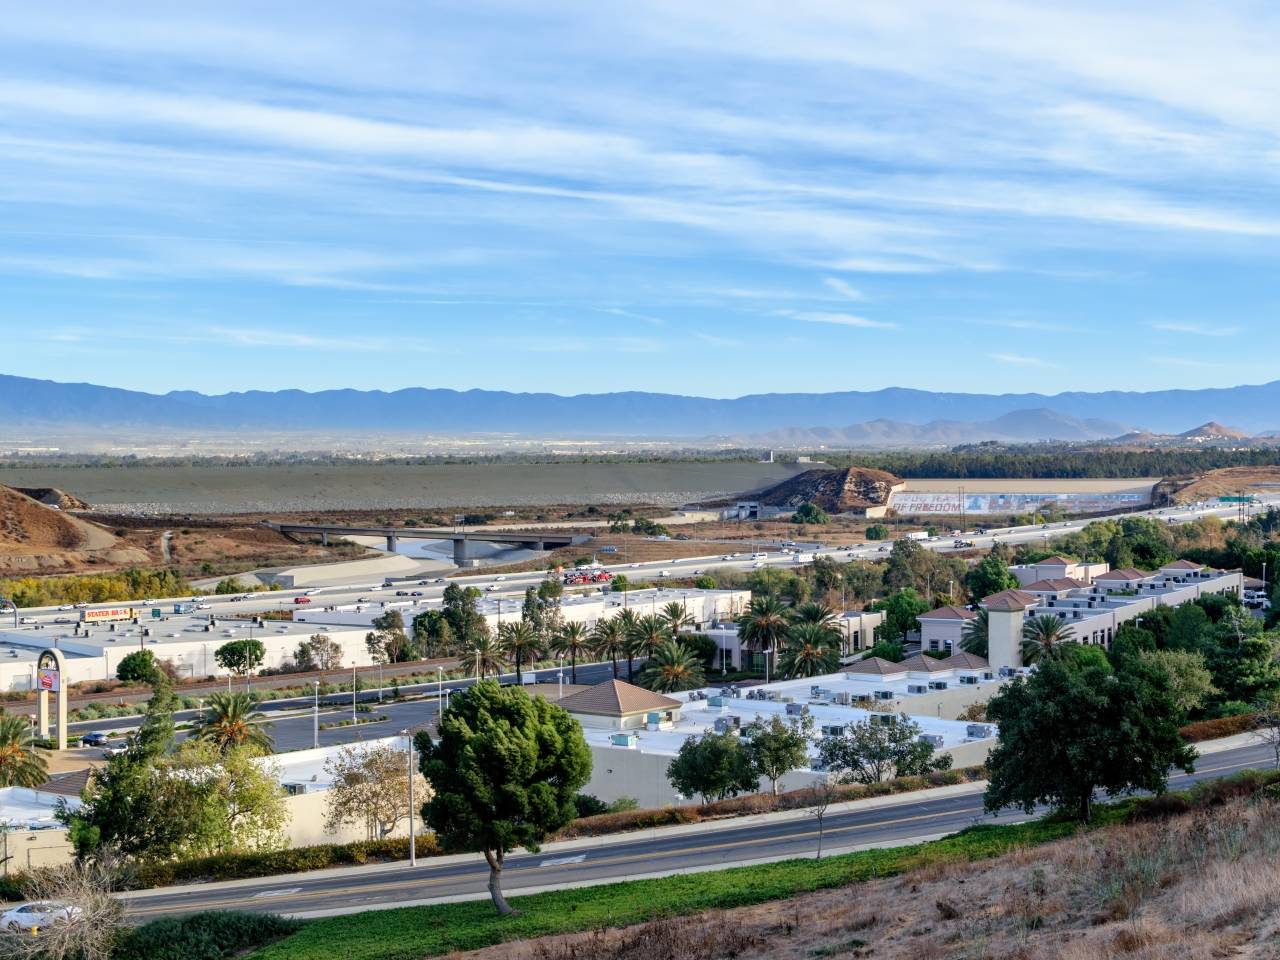
-
Average one-way commute time to work: 36.7 minutes (39% higher than national average)
-
Driving alone in car, truck, or van: 35.3 minutes
-
Carpool: 44.6 minutes
-
Public transportation: 63.7 minutes
-
Workers with one-way commutes over 60 minutes: 23.6% (14.7% more than the national average)
-
Driving alone in car, truck, or van: 21.7%
-
Carpool: 33.4%
-
Public transportation: 57.1%
-
Workers 16 years and over: 76,203
-
Workers who drove a car, truck, or van: 59,157
-
Workers carpooling: 9,933
-
Workers taking public transportation: 1,231
-
Workers who commute outside their county of residence: 49.1%
-
Workers who commute outside their state of residence: 0.5%
9. Jersey City, NJ
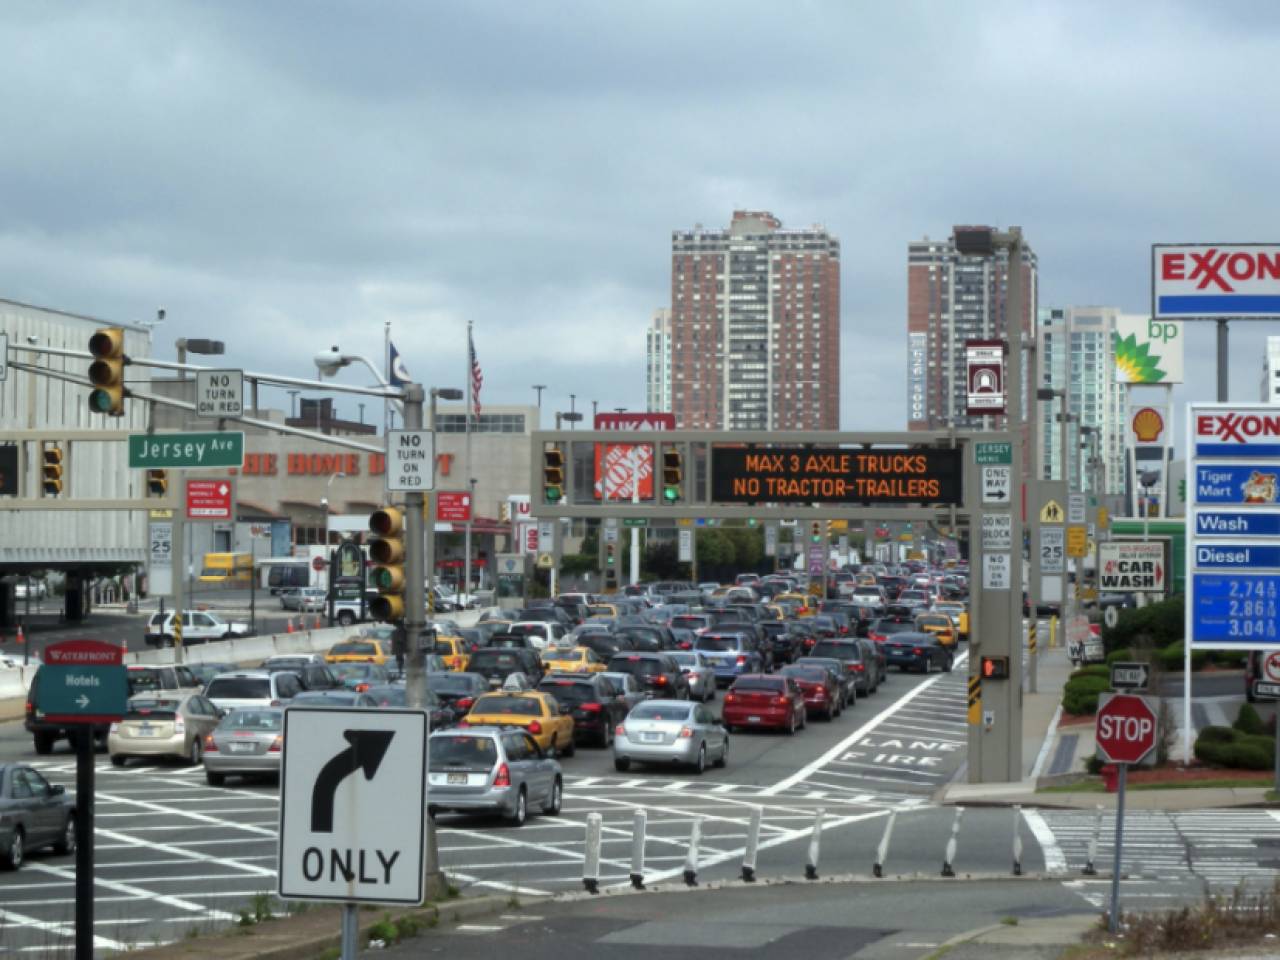
-
Average one-way commute time to work: 36.8 minutes (39.4% higher than national average)
-
Driving alone in car, truck, or van: 30.9 minutes
-
Carpool: 31.3 minutes
-
Public transportation: 45.1 minutes
-
Workers with one-way commutes over 60 minutes: 18.7% (9.8% more than the national average)
-
Driving alone in car, truck, or van: 11.5%
-
Carpool: 14.7%
-
Public transportation: 27%
-
Workers 16 years and over: 133,529
-
Workers who drove a car, truck, or van: 42,190
-
Workers carpooling: 9,236
-
Workers taking public transportation: 64,735
-
Workers who commute outside their county of residence: 17.8%
-
Workers who commute outside their state of residence: 36.5%
8. San Ramon, CA
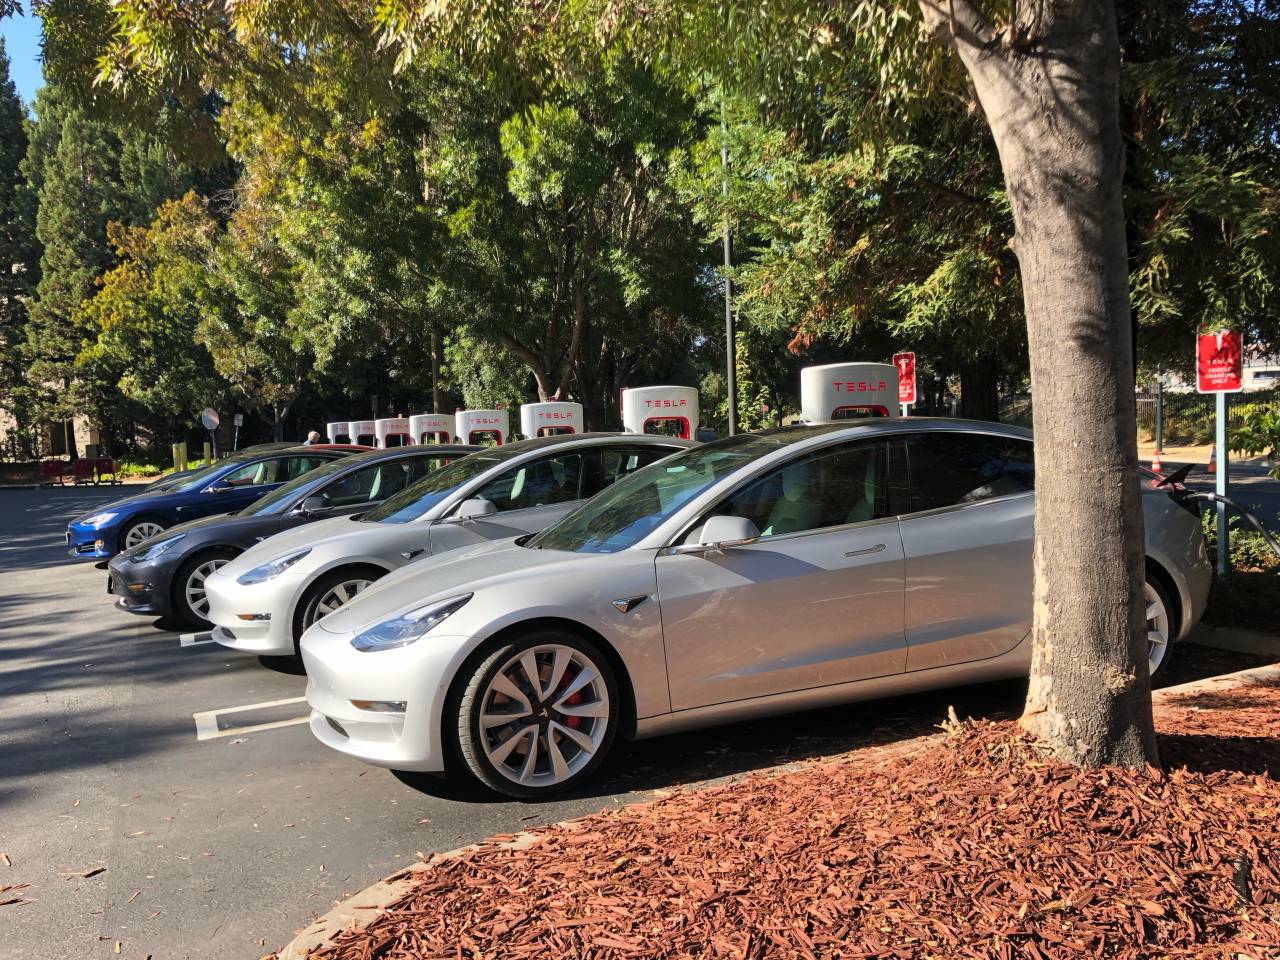
-
Average one-way commute time to work: 37.2 minutes (40.9% higher than national average)
-
Driving alone in car, truck, or van: 33 minutes
-
Carpool: 41.9 minutes
-
Public transportation: 74.7 minutes
-
Workers with one-way commutes over 60 minutes: 25.4% (16.5% more than the national average)
-
Driving alone in car, truck, or van: 18.4%
-
Carpool: 32.8%
-
Public transportation: 85.9%
-
Workers 16 years and over: 36,182
-
Workers who drove a car, truck, or van: 26,543
-
Workers carpooling: 2,849
-
Workers taking public transportation: 2,790
-
Workers who commute outside their county of residence: 56.7%
-
Workers who commute outside their state of residence: 0.8%
7. Chino Hills, CA

-
Average one-way commute time to work: 38.9 minutes (47.3% higher than national average)
-
Driving alone in car, truck, or van: 37.9 minutes
-
Carpool: 43.3 minutes
-
Public transportation: 69.1 minutes
-
Workers with one-way commutes over 60 minutes: 23.4% (14.5% more than the national average)
-
Driving alone in car, truck, or van: 21.2%
-
Carpool: 32.5%
-
Public transportation: 77.8%
-
Workers 16 years and over: 37,254
-
Workers who drove a car, truck, or van: 30,201
-
Workers carpooling: 3,836
-
Workers taking public transportation: 586
-
Workers who commute outside their county of residence: 66%
-
Workers who commute outside their state of residence: 0.2%
6. Hoboken, NJ
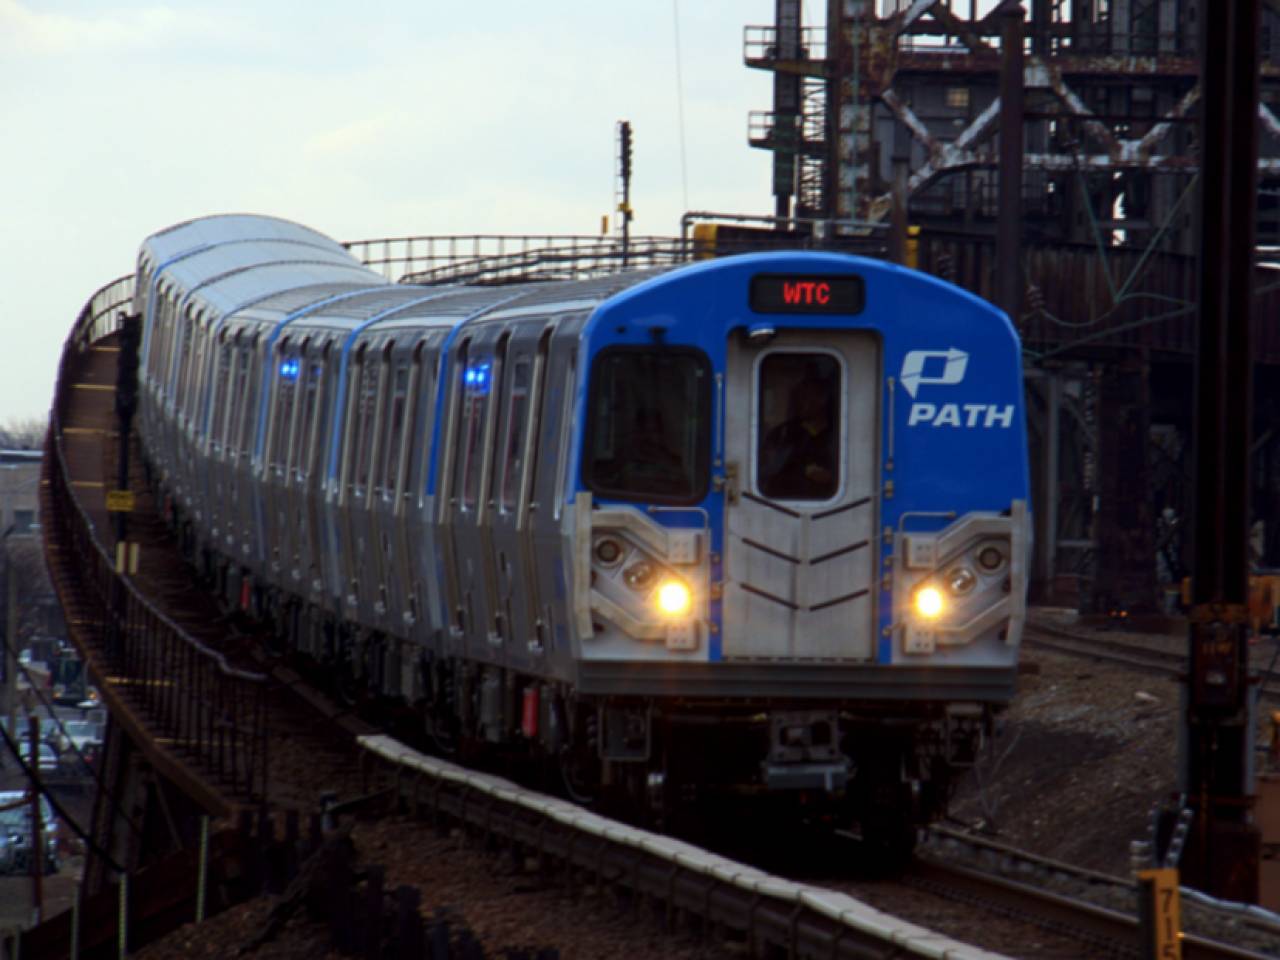
-
Average one-way commute time to work: 39.4 minutes (49.2% higher than national average)
-
Driving alone in car, truck, or van: 40.8 minutes
-
Carpool: 39.9 minutes
-
Public transportation: 42.2 minutes
-
Workers with one-way commutes over 60 minutes: 13.6% (4.7% more than the national average)
-
Driving alone in car, truck, or van: 20%
-
Carpool: 18%
-
Public transportation: 12.7%
-
Workers 16 years and over: 35,394
-
Workers who drove a car, truck, or van: 8,405
-
Workers carpooling: 655
-
Workers taking public transportation: 21,572
-
Workers who commute outside their county of residence: 18.6%
-
Workers who commute outside their state of residence: 57.5%
5. Dale City, VA
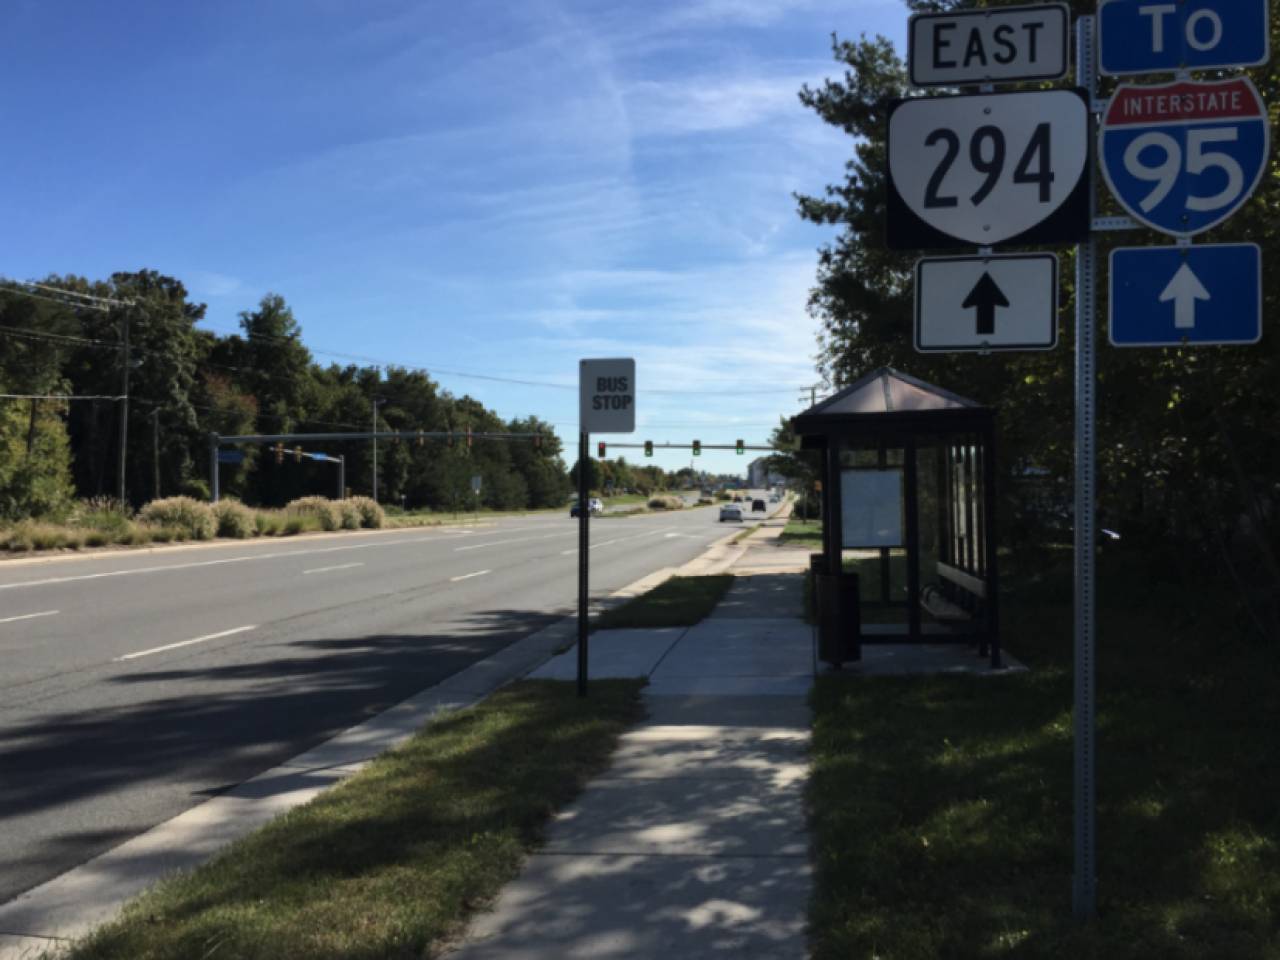
-
Average one-way commute time to work: 39.4 minutes (49.2% higher than national average)
-
Driving alone in car, truck, or van: 37.5 minutes
-
Carpool: 43.9 minutes
-
Public transportation: 61.9 minutes
-
Workers with one-way commutes over 60 minutes: 25.2% (16.3% more than the national average)
-
Driving alone in car, truck, or van: 21.3%
-
Carpool: 33.7%
-
Public transportation: 66%
-
Workers 16 years and over: 37,302
-
Workers who drove a car, truck, or van: 28,424
-
Workers carpooling: 4,652
-
Workers taking public transportation: 2,023
-
Workers who commute outside their county of residence: 46.1%
-
Workers who commute outside their state of residence: 14.3%
4. New York, NY
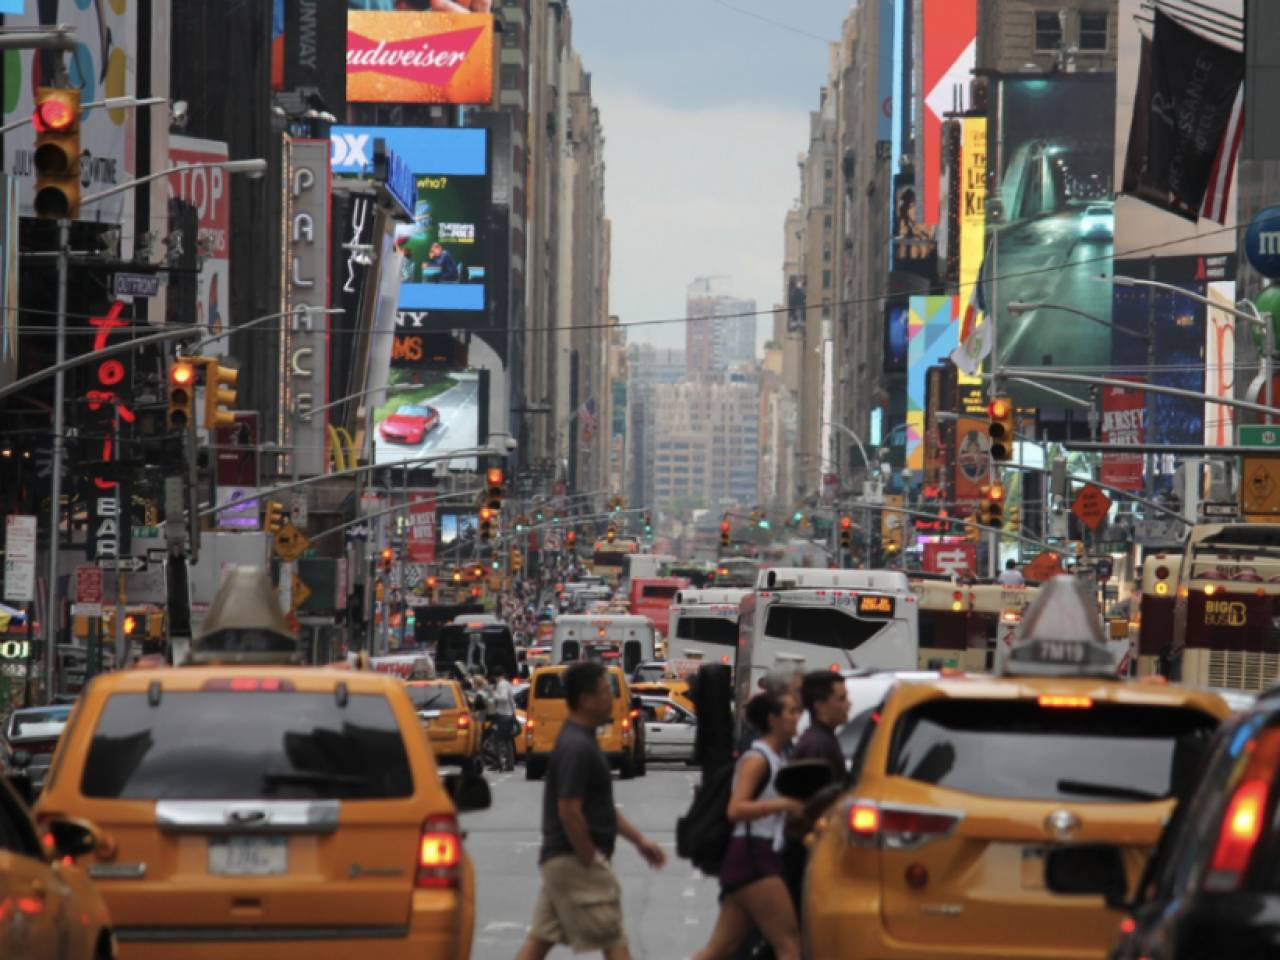
-
Average one-way commute time to work: 40.8 minutes (54.5% higher than national average)
-
Driving alone in car, truck, or van: 33.9 minutes
-
Carpool: 37.9 minutes
-
Public transportation: 48.7 minutes
-
Workers with one-way commutes over 60 minutes: 26.1% (17.2% more than the national average)
-
Driving alone in car, truck, or van: 16.2%
-
Carpool: 21.3%
-
Public transportation: 35.5%
-
Workers 16 years and over: 3,975,121
-
Workers who drove a car, truck, or van: 874,860
-
Workers carpooling: 183,025
-
Workers taking public transportation: 2,247,732
-
Workers who commute outside their county of residence: 42.8%
-
Workers who commute outside their state of residence: 2.8%
3. Palmdale, CA
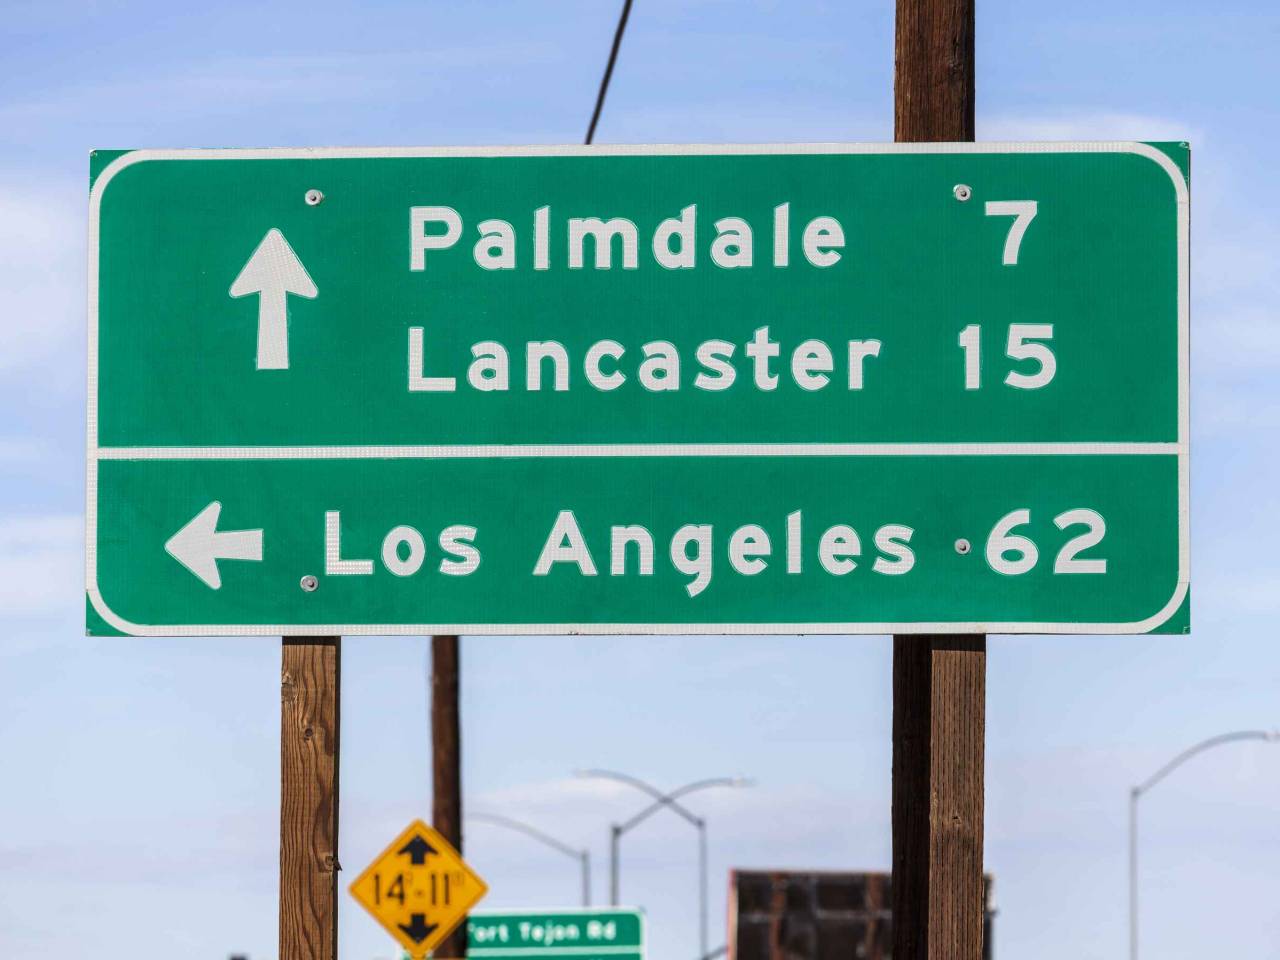
-
Average one-way commute time to work: 42.7 minutes (61.7% higher than national average)
-
Driving alone in car, truck, or van: 39.2 minutes
-
Carpool: 55.6 minutes
-
Public transportation: 86.6 minutes
-
Workers with one-way commutes over 60 minutes: 35% (26.1% more than the national average)
-
Driving alone in car, truck, or van: 30.8%
-
Carpool: 52%
-
Public transportation: 81%
-
Workers 16 years and over: 59,045
-
Workers who drove a car, truck, or van: 45,132
-
Workers carpooling: 8,851
-
Workers taking public transportation: 1,159
-
Workers who commute outside their county of residence: 5%
-
Workers who commute outside their state of residence: 0.4%
2. Tracy, CA
-
Average one-way commute time to work: 43.5 minutes (64.8% higher than national average)
-
Driving alone in car, truck, or van: 39.9 minutes
-
Carpool: 54.7 minutes
-
Public transportation: 91.3 minutes
-
Workers with one-way commutes over 60 minutes: 35.3% (26.4% more than the national average)
-
Driving alone in car, truck, or van: 31%
-
Carpool: 49.6%
-
Public transportation: 89.6%
-
Workers 16 years and over: 40,381
-
Workers who drove a car, truck, or van: 29,959
-
Workers carpooling: 6,558
-
Workers taking public transportation: 1,190
-
Workers who commute outside their county of residence: 55.8%
-
Workers who commute outside their state of residence: 0.4%
1. Antioch, CA

-
Average one-way commute time to work: 45.4 minutes (72.0% higher than national average)
-
Driving alone in car, truck, or van: 41 minutes
-
Carpool: 49.7 minutes
-
Public transportation: 82.3 minutes
-
Workers with one-way commutes over 60 minutes: 33.5% (24.6% more than the national average)
-
Driving alone in car, truck, or van: 27.1%
-
Carpool: 39.1%
-
Public transportation: 85.8%
-
Workers 16 years and over: 47,238
-
Workers who drove a car, truck, or van: 32,427
-
Workers carpooling: 7,809
-
Workers taking public transportation: 3,643
-
Workers who commute outside their county of residence: 32.3%
-
Workers who commute outside their state of residence: 0.4%
Smart investing starts here
Get 100 free online equity trades with promo code EDGE100 when you open a CIBC Investor’s Edge account by Sept. 30, 2025. Click here to unlock 100 free trades and take control of your investments. Get started today.


